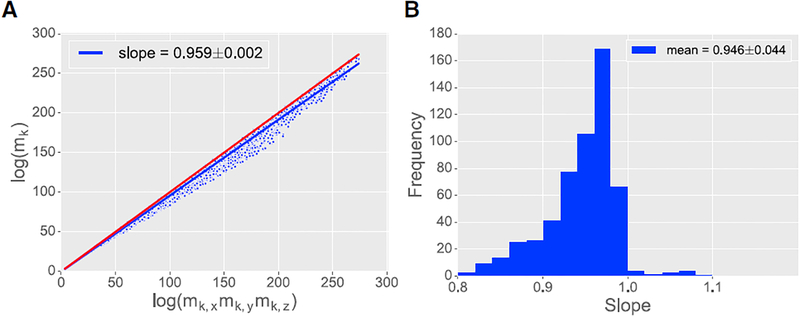
Figure 2. Separability of Plant Architectures.
(A) Log-log plot of the product moments (mk) versus the product of the separated moments (mk,xmk,ymk,z) for even values of k between 0 and 20. There is one dot per moment order per plant scan (557 architectures×11 moment orders = 6127 total dots). The blue line shows the least-squares fit to the data with slope of 0:959 ± 0:002, computed using all values of k plotted together. The red line indicates exact separability with a slope of 1. Plant architectures are nearly, but not exactly, separable.
(B) Frequency histogram of the separability slope calculated for each individual plant over all its moment orders (i.e., 557 slopes; one slope calculated per plant). The average slope was 0.946 with SD of 0.044.
See also Figure S1.

