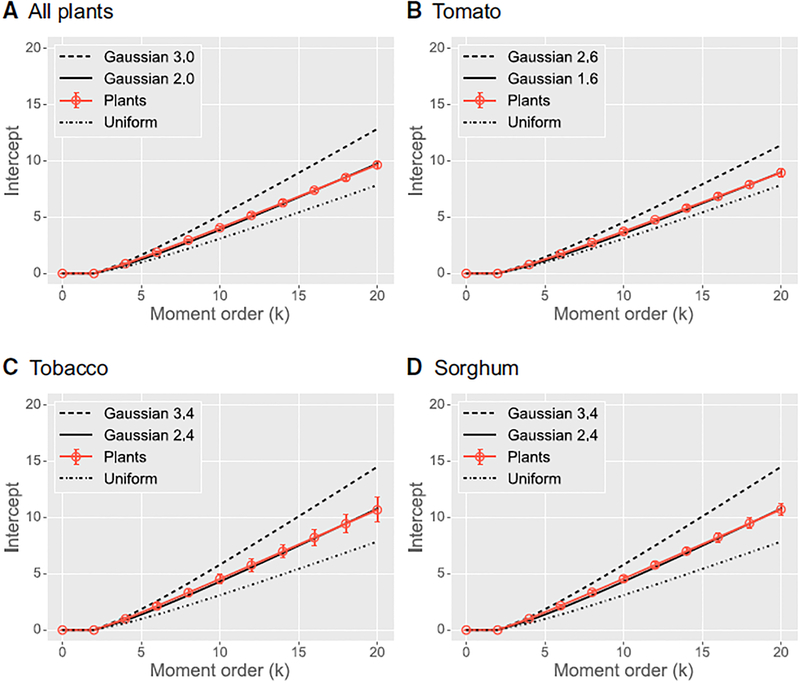
Figure 4. Plant Gaussian Spatial Density Functions.
Plots of the intercepts of the self-similarity lines in Figure 3B versus moment order for (A) all plants together, (B) tomato only, (C) tobacco only, and (D) sorghum only. Each panel depicts the intercepts of the plants (solid brown line) with those of a closely matched function (solid black line), as well as a uniform density, and a Gaussian with a larger SD. Error bars denote 99% confidence intervals. Intercepts for the uniform and Gaussian densities for various truncations were computed analytically [30]. Intercepts for k = 0 and k = 2 are both equal to log(1) = 0 due to normalization to unit length and unit variance. See also Figure S3.

