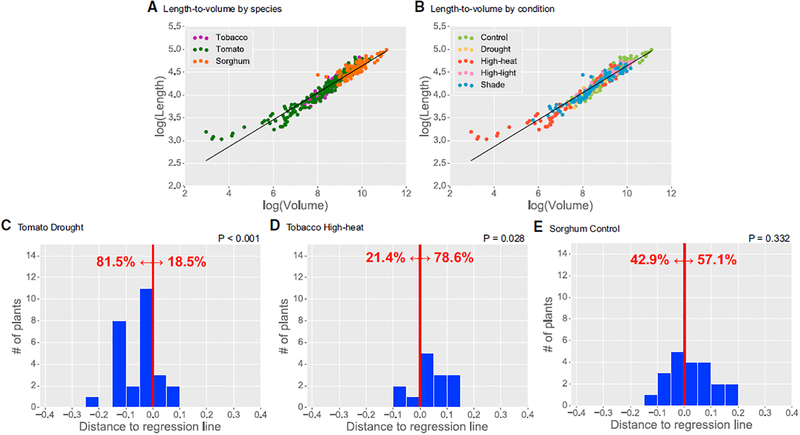
Figure 5. Length versus Volume Comparison.
(A and B) Log-log plots of total length (y axis) versus total volume (x axis) of the architecture, grouped by (A) species and (B) condition. Regression line is shown in black. Analysis includes all plants day 8 and higher.
(C–E) Histograms showing the number of plants in three different species-condition pairs—(C) tomato drought, (D) tobacco high-heat, and (E) sorghum control—that lie above or below the regression line, shown as to the right or left, respectively, of the red line. For example, 78.6% of tobacco plants grown in high heat lie significantly above the regression line, i.e., they occupy a smaller volume for the same length compared to the average. Sorghum plants are split evenly above and below the regression line.
See also Figure S5.

