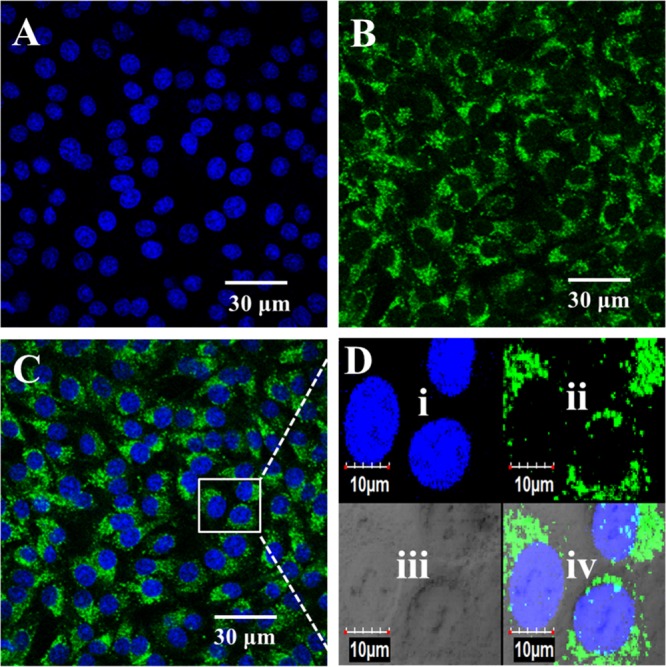
Figure 6.

Interaction of BHK cells with PMMA–PTE nanoparticles at a concentration of 25 ppm. The images represent the nucleus stained with DAPI (A), cellular matrix stained with nanoparticles (B), and an overlay of the two images (C), with the magnified images in the inset showing nanoparticle distribution inside the cells (D). Magnified view (D) of nucleus stained with DAPI (i), cellular matrix stained with nanoparticles (ii), cells observed under DIC mode (iii), and overlay of (i)–(iv). The cells were imaged at a magnification of 60× oil objective using a confocal microscope (Olympus FV1000).
