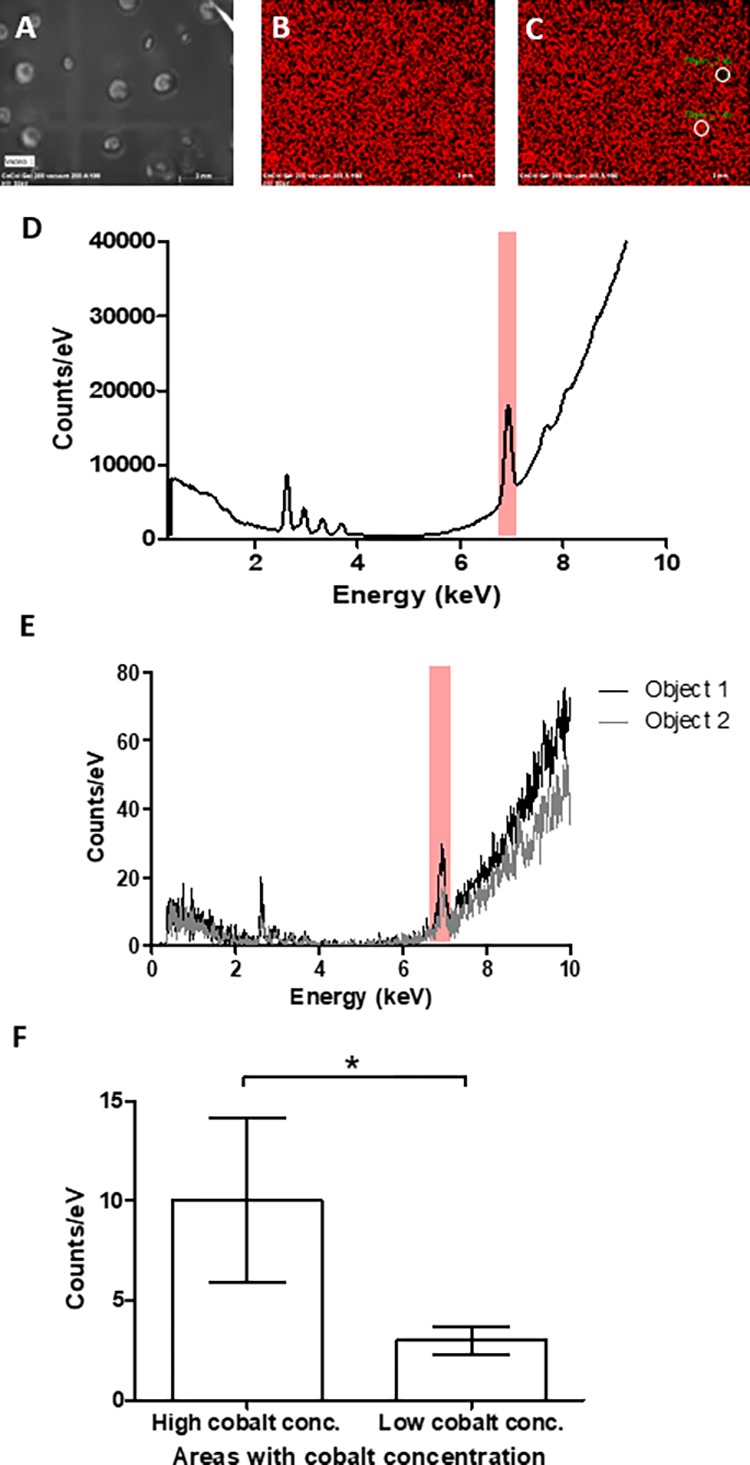
Figure 4.

X-ray fluorescent measurements of cobalt distribution in a 200 ppm collagen hydrogel. (A) Bright-field image of bulk hydrogel, (B) relative cobalt intensity throughout hydrogel, (C) an example of positions of object 1 and object 2 in relation to bulk hydrogel, (D) spectra of gel with cobalt highlighted, (E) spectra of both object 1 and object 2 used to obtain an average of a 3-fold increase in cobalt fluorescence, and (F) average cobalt concentration of all object areas separated by relatively high and low concentrations, giving a P value <0.1.
