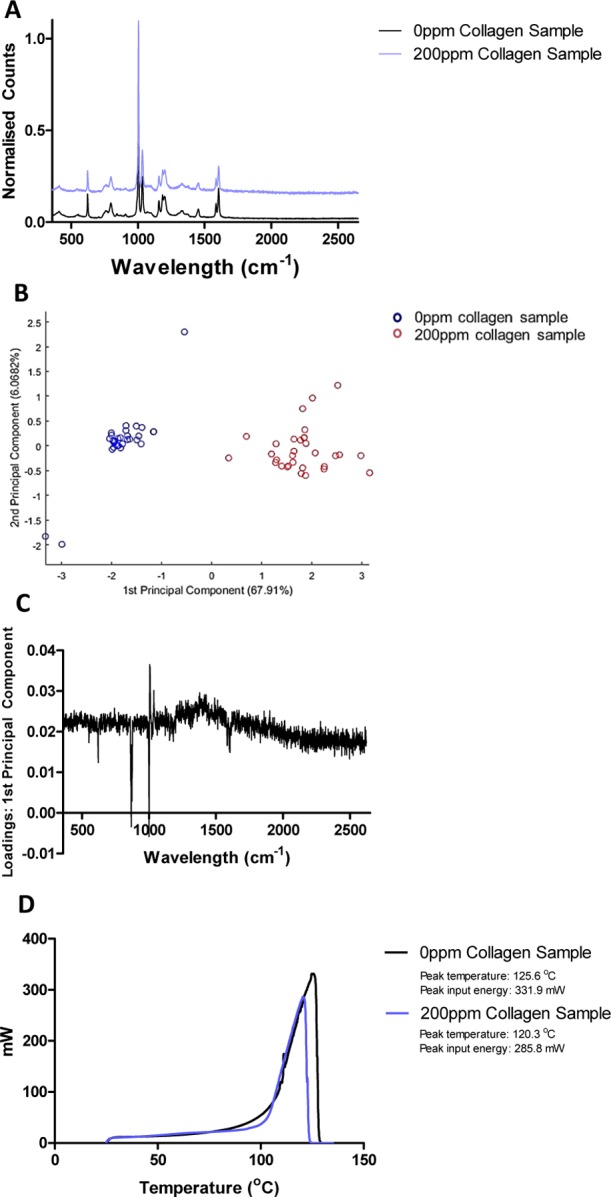
Figure 7.

(A) Raman spectra of both 0 ppm collagen and 200 ppm collagen hydrogels, (B) score plots of the first two principal components, (C) loading plots of the first principal component indicating changes at 1000 and 869 cm–1, and (D) DSC measurements indicating a reduction in energy required to remove bulk water between 0 and 200 ppm CoCol gels.
