
Extended Data Figure 7. Genomic tracks surrounding the co-inhibitory molecules.
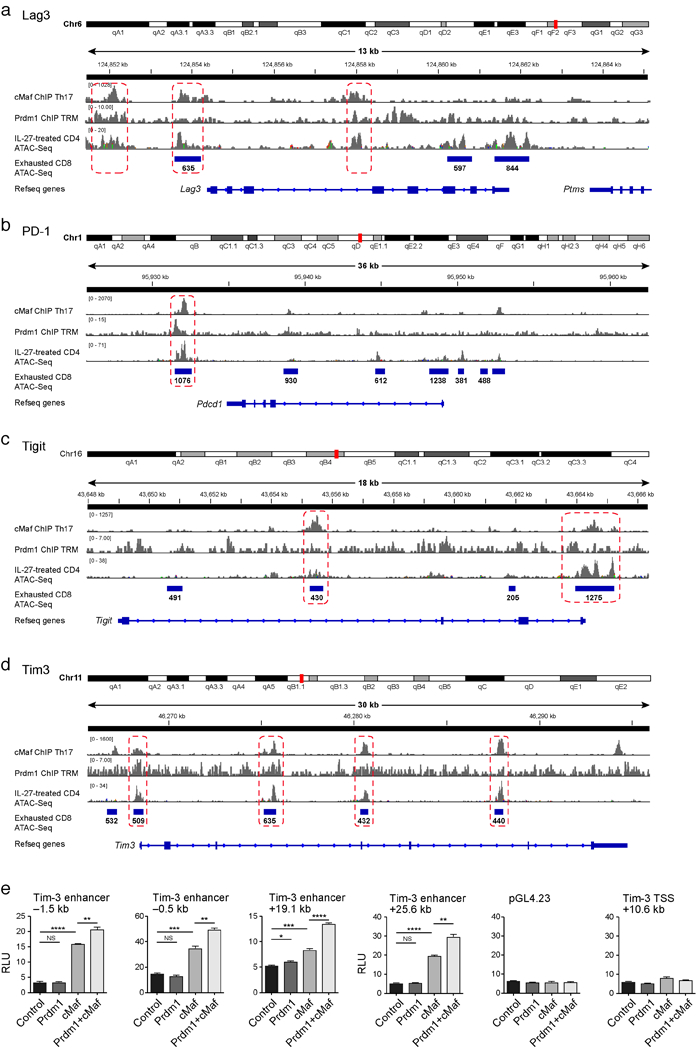
Lag3 (a), Pd-1 (b), Tigit (c) and Tim-3 (d) with overlay of Chipseq data of Prdm116 and c-Maf19 and ATACseq data of naïve CD4+ cells induced with IL27 for 72h and ATACseq data of CD8+ T cells 27 days following chronic viral infection22. Regions of binding sites common to both Prdm1 and c-Maf are indicated by the dotted rectangles. e) Luciferase activity in 293T cells transfected with pGL4.23 luciferase reporters for depicted enhancers of Tim-3 together with empty vector (control), constructs encoding Prdm1, c-Maf, or both. Firefly luciferase activity was measured 48h after transfection and is presented relative to constitutive Renilla luciferase activity.