
Figure 3. Prdm1 and c-Maf individually regulate co-inhibitory receptors on T cells.
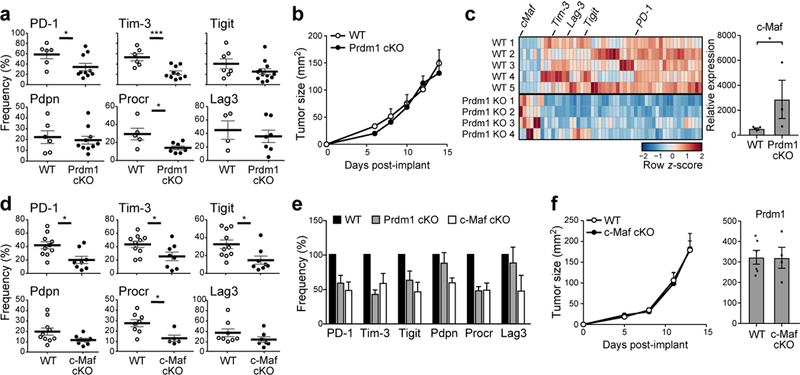
a) Summary data of co-inhibitory receptor expression on CD8+ TILs from WT and Prdm1 cKO mice bearing B16F10 melanoma. Data are from biologically independent animals. mean + s.e.m is shown. *p<0.05, ***p<0.001, two-sided t-test. b) WT (n=5) and Prdm1 cKO (n=5) mice were implanted with B16F10 melanoma. Mean tumor size + s.e.m. is shown. Data are from 3 biologically independent experiments. c) Left panel, gene expression in CD8+ TILs from WT and Prdm1 cKO mice bearing B16F10 melanoma was analyzed by n-counter code-set (Supplementary Information Table 3). Differentially expressed genes are shown as a heatmap. Right panel, expression of c-Maf in CD8+ TILs from WT and Prdm1 cKO mice as determined by qPCR. Data are from biologically independent animals. mean + s.e.m is shown. p = 0.03, two-sided t-test. d) Summary data of co-inhibitory receptor expression on CD8+ TILs from WT and c-Maf cKO. Data are from biologically independent animals. mean + s.e.m is shown. *p < 0.05, two-sided t-test. e) Frequency of co-inhibitory receptor expression of Prdm1 cKO (gray bar) and c-Maf cKO (open bar) CD8+ TILs relative to WT (filled bar). Data are from 3a and 3d, mean + s.e.m is shown. f) Left panel, WT (n=8) and c-Maf cKO (n=5) mice were implanted with B16F10 melanoma. Mean tumor size + s.e.m is shown. Data are from two biologically independent experiments. Right panel, expression of Prdm1 in CD8+ TILs from WT and c-Maf cKO mice as determined by qPCR.