
Figure 5. Loop formation in and compaction of transcribed regions upon blocking transcription elongation with flavopiridol.
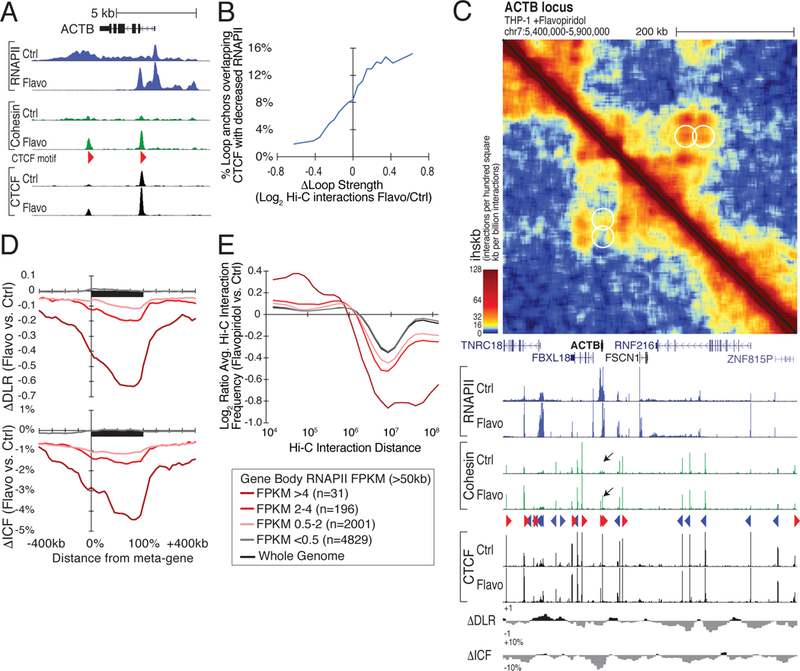
(A) Flavopiridol stalls RNAPII at regulatory elements, enabling cohesin to accumulate at intragenic CTCF sites. Genome browser tracks of RNAPII, cohesin, and CTCF at the ACTB locus in control and flavopiridol-treated THP-1 cells. (B) Loops that strengthen with elongation inhibition overlap CTCF sites that become less transcribed flavopiridol. Moving average showing the fraction of loops with anchors overlapping CTCF sites that lose RNAPII following flavopiridol treatment plotted against the change in loop strength. (C) Gain of loops at CTCF sites located within the ACTB gene body. Hi-C contact map and RNAPII, cohesin, and CTCF ChIP-seq signal at the ACTB locus in control- (lower left) and flavopiridol- (upper right) treated THP-1 cells. Black arrows mark CTCF sites that gain cohesin following flavopiridol treatment. (D) Highly transcribed genes exhibit greater compaction along their gene bodies after flavopiridol treatment. Meta-gene profiles of changes in ΔDLR and ΔICF for genes longer than 50 kb separated by RNAPII levels in control THP-1 cells. (E) Log2 ratio of Hi-C interaction frequencies relative to interaction distance in flavopiridol versus control-treated THP-1 cells at long genes (>50 kb) segregated by their RNAPII levels. See also Figure S5.