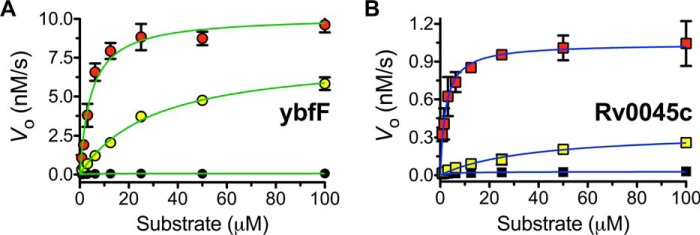
Figure 2.
Kinetic plots for fluorogenic SAR substrates against ybfF and Rv0045c. The kinetic activity of ybfF (A; 523 nm) and Rv0045c (B; 423 nm) against series 2 was measured by following the increase in fluorescein fluorescence (λex = 485 nm, λem = 528 nm) over time (7.5 min, collecting data every 50 s) at eight substrate dilutions (100 to 0.78 μm). The saturation enzyme kinetic traces were fitted to the Michaelis–Menten equation, and values for kcat, Km, and kcat/Km were calculated. All measurements were completed in triplicate substrate dilution and are shown ± S.D. (error bars). A, Michaelis–Menten plot of series 2 with ybfF (green). B, Michaelis–Menten plot of series 2 with Rv0045c (blue). Substrates are shown as follows: 2C (black), 2O (red), 2S (yellow).

