Figure 3.
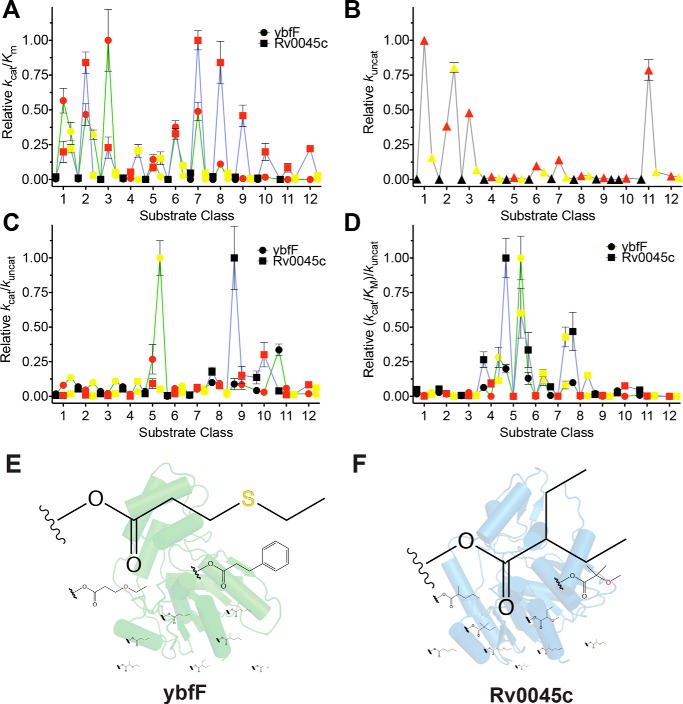
Comprehensive kinetic comparison of two homologous esterases. A, catalytic specificity (kcat/Km) comparison between ybfF (green line with circles) and Rv0045c (blue line with squares). Fluorogenic series are color-coded with carbon substrates in black, oxygen substrates in red, and sulfur substrates in yellow (Fig. 1A). Catalytic specificities were normalized based on the highest specificity for each enzyme. Kinetic constants calculated by fitting the hydrolysis reactions to the Michaelis–Menten equation and solving for values of kcat, Km, and kcat/Km. Complete kinetic values provided in Tables S1–S34. B, uncatalyzed rate of hydrolysis for each substrate. Substrates are colored identically to A. The uncatalyzed rate was calculated by measuring the hydrolysis of each fluorogenic substrate (10 μm) for 6 h in PBS at 25 °C and solving for the rate of hydrolysis by finding the slope of the linear regression. C, catalytic effectiveness (kcat/kuncat) comparison between ybfF and Rv0045c, colored identically to A. D, catalytic proficiency ((kcat/Km)/kuncat) comparison between ybfF and Rv0045c, colored identically to A. E, top 10 catalytic effectiveness substrates for ybfF. Substrates sized based on relative catalytic effectiveness against ybfF. F, top 10 catalytic effectiveness substrates for Rv0045c. Substrates are sized based on relative catalytic effectiveness against Rv0045c.

