Figure 6.
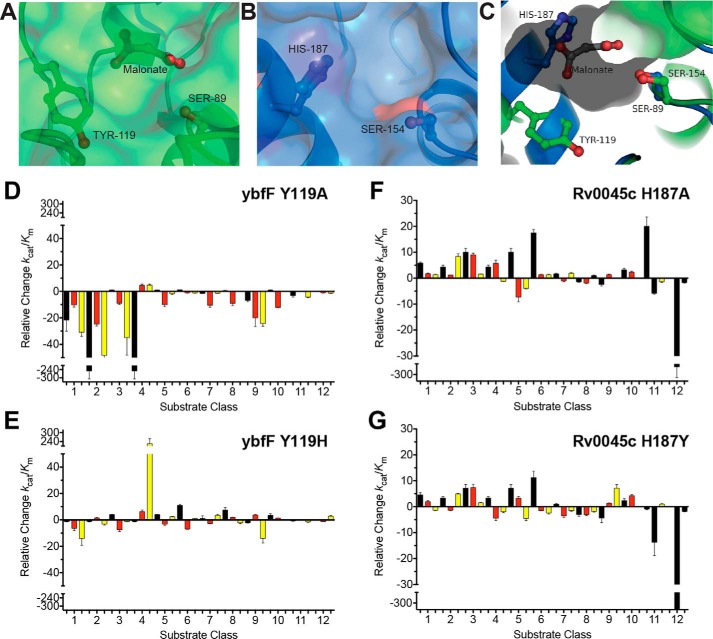
Reciprocal substrate discrimination residues. A and B, comparison of the binding pocket structures between ybfF (A; green) and Rv0045c (B; blue) showing the catalytic serine and substrate differentiation residues in sticks. For ybfF, the bound malonate is also shown in sticks. C, aligned binding pocket structure between ybfF (green) and Rv0045c (blue). The binding pocket surface for ybfF is shown to illustrate the relative positioning of the two differentiation residues within the pocket. Coloration and representation are identical to those in A and B. D–G, relative shifts in catalytic specificity (kcat/Km) for ybfF and Rv0045c upon substitution of substrate discrimination residues to alanine (D and F) and to reciprocal residues (E and G). Catalytic specificity ratios of variants with higher activity than the WT enzyme were calculated by (kcat/Km)variant/(kcat/Km)WT. Relative ratios for variants with higher activity than the WT enzyme were assigned positive values to showcase the increased activity of that variant from the WT enzyme. Catalytic specificity ratios of variants with lower activity than the WT enzyme were calculated by dividing the (kcat/Km)WT/(kcat/Km)variant. Relative ratios for variants with lower activity than the WT enzyme were assigned negative values to showcase the decreased activity of that variant from the WT enzyme. Detailed kinetic values are given in Tables S3–S34. Error bars, S.D.

