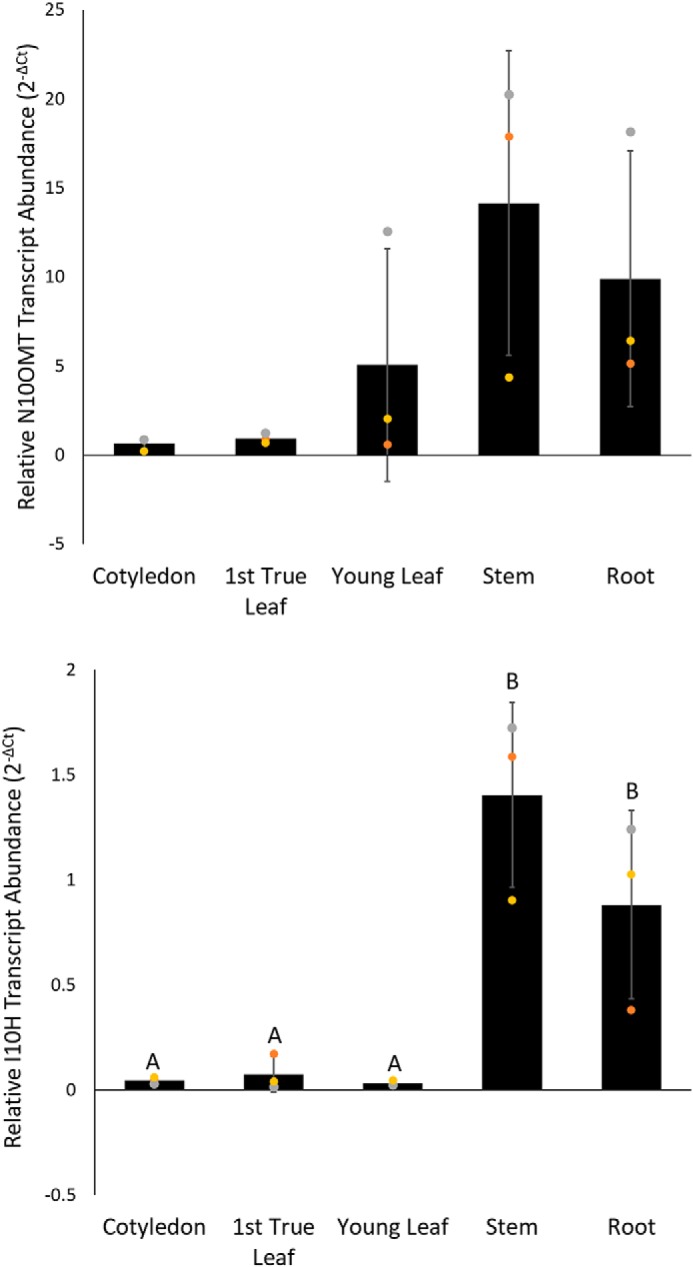
Figure 8.

Relative transcript abundance of I10H and N10OMT in T. iboga plant organs. Real-time quantitative PCR was used to quantify the relative transcript abundance in root, stem, first true leaf, and young leaf and cotyledon of iboga seedlings. Data were calculated in Excel using 2−ΔCt and expressed as the mean ± S.D. (error bars). Each data point is indicated with a gray, gold, or orange marker. Three biological replicates and three technical replicates were analyzed for each gene using the reference gene: N2227-like family protein, N2227. Efficiencies for all primer sets were approximately equal and always >90%. Values with the same letter are not significantly different (ANOVA with Tukey PHT, p > 0.05).
