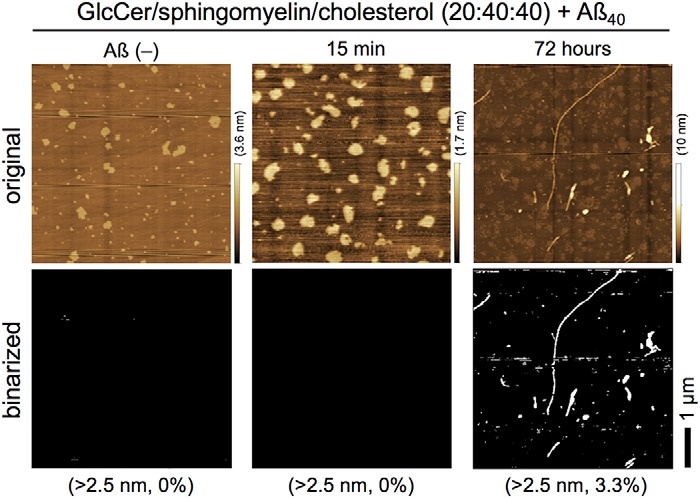
Figure 2.

Formation of Aβ fibrils on GlcCer-enriched membranes. Upper panel, AFM images of GlcCer/sphingomyelin/cholesterol (20:40:40) membranes after incubation with 10 μm Aβ40 at 37 °C for 0 min (Aβ(−)), 15 min, and 72 h. Heights are indicated by color bars. Lower panel, binarized AFM images were obtained via thresholding at 2.5 nm from the bottom, and percentages represent the total area higher than the indicated height. Scale bar, 1 μm.
