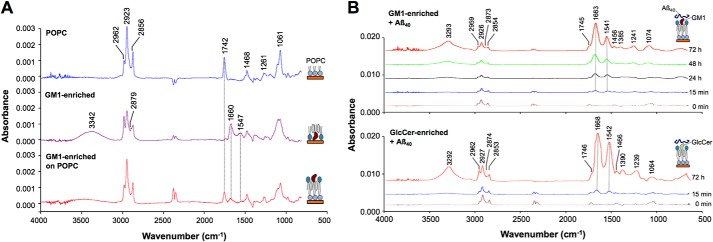
Figure 3.
FTIR reflection–absorption spectra of GM1-enriched membrane. A, a POPC monolayer (top), a GM1/sphingomyelin/cholesterol (20:40:40) monolayer (middle), and a bilayer of POPC and GM1/sphingomyelin/cholesterol (20:40:40) (bottom). Peak assignments are listed in Table 1. B, GM1/sphingomyelin/cholesterol (20:40:40) (upper panel) and GlcCer/sphingomyelin/cholesterol (20:40:40) (lower panel) membranes after incubation with Aβ40 for 0 min to 72 h. Amide I and amide II are around 1663–1668 and 1541–1542 cm−1, respectively. Peak assignments are listed in Table S1.

