Figure 6.
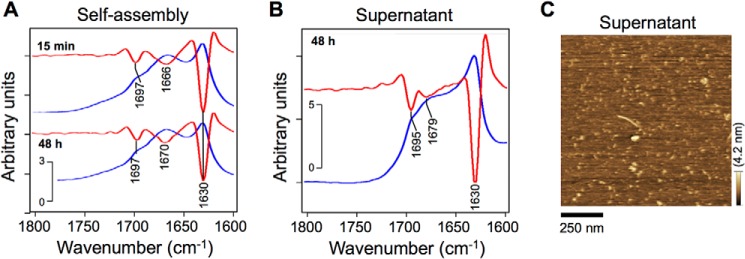
Formation of Aβ40 assemblies in solution. A and B, raw (blue lines) and second-derivative (red lines) attenuated total reflection amide I spectra of self-assembled Aβ40 (A) and residual Aβ40 in the supernatant of solution on GM1-enriched membranes (B). After incubation at 25 °C for 15 min to 48 h, samples were dropped on a suitable plate and dried under nitrogen gas. C, an AFM image of residual Aβ40 in the supernatant of solution after 48 h on GM1-enriched membranes. GM1/sphingomyelin/cholesterol (20:40:40) membrane was incubated with 10 μm Aβ40 at 37 °C for 48 h, and thereafter the supernatant was dropped on a mica plate for 15 min. After washing, Aβ40 deposited on the mica was imaged via AFM in water.

