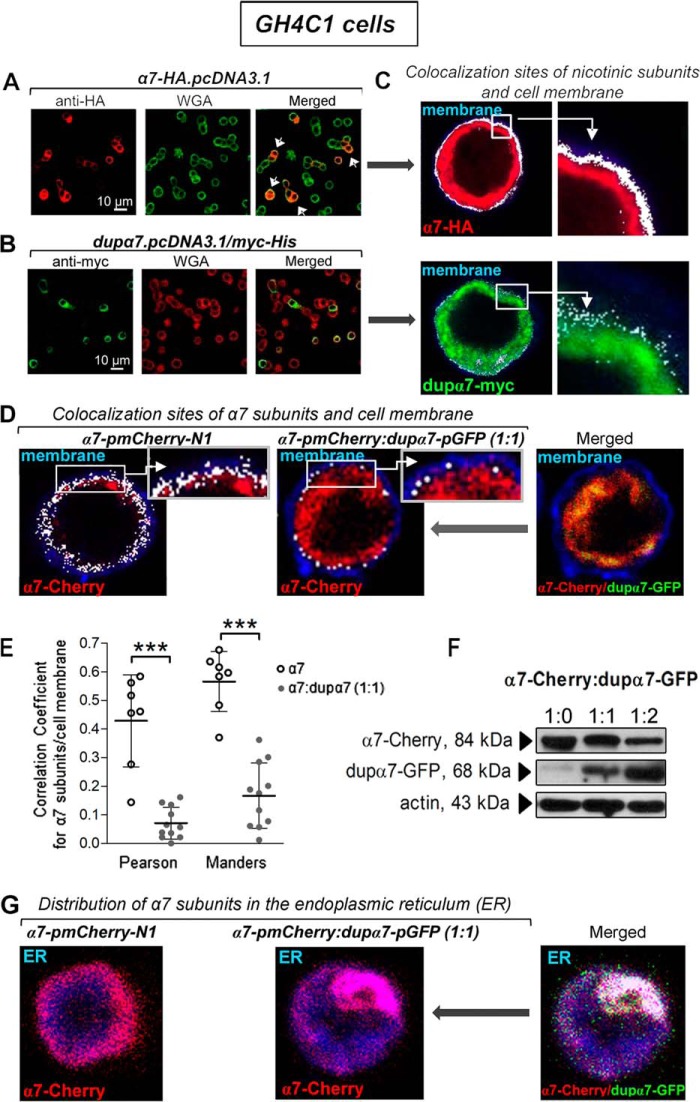
Figure 1.
Cellular distribution of α7 and dupα7 subunits expressed separately or in combination in GH4C1 cells. A and B, left panels show confocal images representative of cells expressing either α7-HA (red) or dupα7-Myc (green) subunits after the respective epitopes were immunostained. The center panels show the plasma membrane of the same cells (green and red, respectively) labeled with Alexa Fluor 633–WGA. The panels on right (merged) show the cells with successful expression of α7 subunits (indicated by white arrows) reaching the cell membrane (yellow/orange), in contrast to the expression of dupα7-Myc subunits mostly located in the cytosol. C, image of double-positive structures (white dots) of the coinciding labeling region of α7 or dupα7 subunits and the plasma membrane generated by using the Leica software “colocalization function” in the above cells. D, same software was employed to qualitatively analyze the colocalization sites (white dots) of α7-Cherry subunits and plasma membrane (blue) in two WGA-stained cells transfected with the α7-pmCherry construct, alone or in combination with the dupα7-GFP construct; higher magnifications of colocalization sites in boxed areas (insets) are shown. E, evaluation of the dupα7 effect on α7 expression in the cytosolic membrane of cells transfected as described in D using the Pearson's correlation and Manders' overlap coefficients to quantitatively analyze the colocalization of α7-Cherry subunits and Alexa Fluor 633–WGA-stained membranes. The scatter plots show the distribution of the values found in single cells from three different cultures and the mean ± S.D. for each group. ***, p < 0.001 compared with cells transfected only with the α7-pmCherry–N1 construct by using the Student's t test. F, representative immunoblots from the same cell culture of the protein extracts from cells expressing α7-Cherry, combined or not with dupα7-GFP, at the indicated proportions. Specific bands corresponding to α7-Cherry or dupα7-GFP subunits were detected with the appropriate primary (anti-Cherry and anti-GFP) and secondary (HRP)-conjugated antibodies. G, confocal image of the homogeneous distribution of α7-Cherry subunits throughout the ER (blue) in a cell transfected with the indicated construct (left panel). The coexpression of dupα7-GFP together with α7-Cherry in a different cell causes the entrapment of α7 subunits in the form of aggregates in a localized region of the ER, probably hindering the migration to the cell membrane of these subunits conveniently assembled into homomeric α7-nAChRs (center and right images). Images like those obtained in these two cells were also found in other cells from two different cell cultures.

