Figure 3.
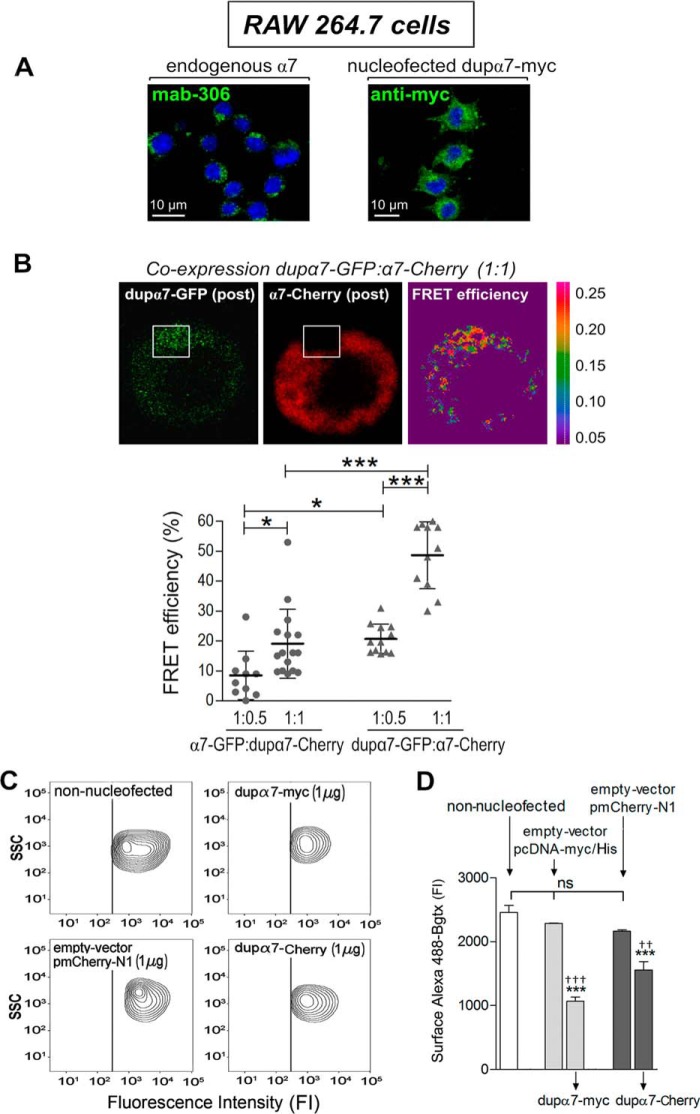
Physical interaction of dupα7 with α7 subunits reduces endogenous expression of functional α7-nAChRs in the plasma membrane of RAW264.7 cells. A, confocal images of the cells revealing the native expression of α7 subunits (left panel) or the successful and abundant expression of foreign dupα7-Myc subunits (right panel) after cell nucleofection with the dupα7.pcDNA3.1/Myc-His construct. The subunits α7 (green) and dupα7-Myc (green) were immunostained, respectively, with either Mab306 or the anti-Myc antibody, followed by the Alexa Fluor 488-conjugated secondary antibody in both cases. Nuclei (blue) appear stained with DAPI. B, upper panels: representative confocal images of FRET in a cell doubly-nucleofected with the pair dupα7-pGFP/α7-pmCherry at a 1:1 ratio; images reveal the increase in the emission at 488 nm of the donor (dupα7-GFP (post)) after photobleaching of the acceptor (α7-Cherry (post)) in the framed area. Right, false-color image showing higher FRET efficiency (red) in the selected area. Lower panel: scatter graph reflecting the FRET efficiency values, expressed as percentage of maximal efficiency, determined in the region of interest for acceptor photobleaching in single cells from three independent cell cultures. The cells were transfected with the pairs of constructs α7-pGFP/dupα7-pmCherry or dupα7-pGFP/α7-pmCherry at 1:0.5 or 1:1 ratios. The horizontal bars show the mean ± S.D. for the group; *, p < 0.05, and ***, p < 0.001, after comparing the indicated groups. C and D, flow cytometry analysis of native expression of functional α7-nAChRs labeled with Alexa Fluor 488–Bgtx in cells nucleofected with the dupα7.pcDNA3.1/Myc-His or pmCherry-tagged dupα7 constructs or with their corresponding empty vectors; non-nucleofected cells were used as a reference. C, representative contour plots showing SCC and cell-surface expression of α7-nAChRs in non-nucleofected cells or in cells nucleofected with the indicated constructs (positive for dupα7-Myc, dupα7-Cherry, or Cherry). D, histogram representing pooled results of the fluorescence intensity corresponding to the Alexa Fluor 488–Bgtx bound to the α7-nAChRs on the cell surface of each cell population. The bars represent means ± S.E. from three independent cell cultures. ***, p < 0.001 compared with non-nucleofected cells; †††, p < 0.001, and ††, p < 0.01 compared with cells nucleofected with the corresponding empty vector. ns is nonsignificant.

