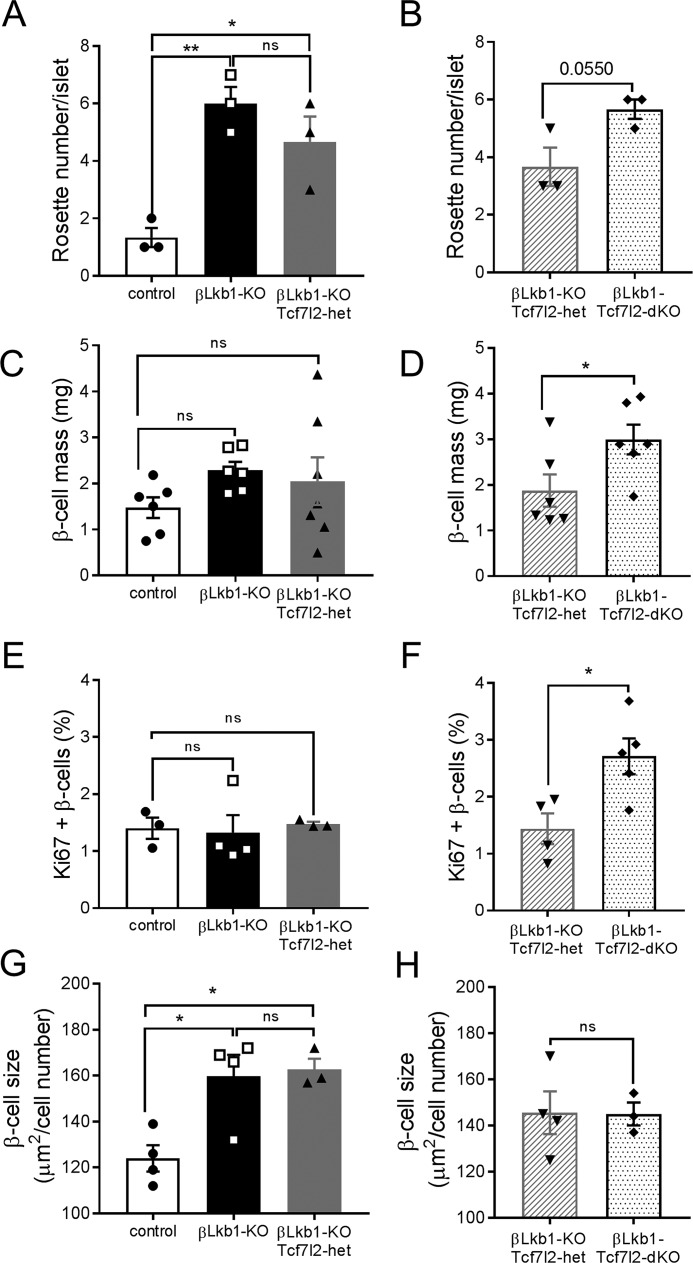
Figure 6.
Effects of Lkb1 or Tcf7l2 deletion on β cell size and mass in males. A and B, rosette-like structure count per islet (n = 3 mice/genotype) in group 1 (A) and in group 2 (B). C and D, β cell mass is the ratio of insulin-positive staining to the total pancreatic surface and pancreas weight (n = 6–7 mice/genotype). E and F, quantification of Ki-67–positive and insulin-positive cells based on 10–15 islets per pancreas (n = 3–4 mice/genotype). G and H, mean β cell size measured as the ratio of the insulin-positive staining surface area to the number of β cells (n = 3–4 mice/genotype) in group 1 (G) and in group 2 (H) (*, p < 0.05; **, p < 0.01). White bars, control; black bars, βLkb1-KO; gray bars, βLkb1-KO-Tcf7l2-het (group 1); gray hatched bars, βLkb1-KO-Tcf7l2-het (group 2); black dotted bars, βLkb1-Tcf7l2-dKO. Error bars represent the mean ±S.E.; ns, not significant.

