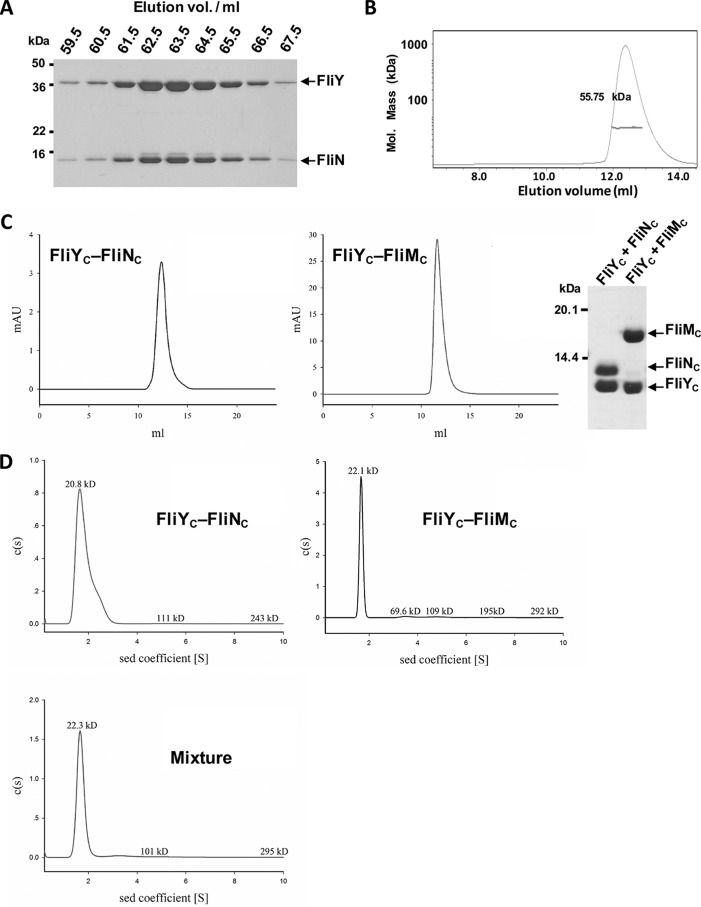
Figure 3.
FliY formed complexes with FliN and FliM. A, copurification analysis. GST-FliY was coexpressed with His6-FliN in E. coli. The protein mixtures were purified by Ni-NTA and GSH-Sepharose chromatography in which the GST fusion tag was removed by 3C protease. The eluted proteins were separated by Superdex S200 gel filtration chromatography and analyzed by SDS-PAGE. B, static light scattering of FliY–FliN. The curve is the refractive interference signal. The value shown is the native molecular mass of FliY–FliN. The line under the peak indicates the calculated molecular mass of the eluted FliY–FliN complex throughout the peak. C, interactions between FliYC and FliNC or FliMC. GST-FliYC was coexpressed with His6-FliNC or His6-FliMC. The proteins were finally separated by Superdex S75 chromatography. The purified complexes were analyzed by SDS-PAGE. D, the sedimentation velocity analysis of FliYC–FliNC, FliYC–FliMC, and a mixture of the two complexes. All data were collected using an absorbance optical system at a wavelength of 280 nm. Data analysis was performed with SEDFIT, and data were also analyzed using the sedimentation (sed) coefficient distribution model, c(s). mAU, milliabsorbance units.

