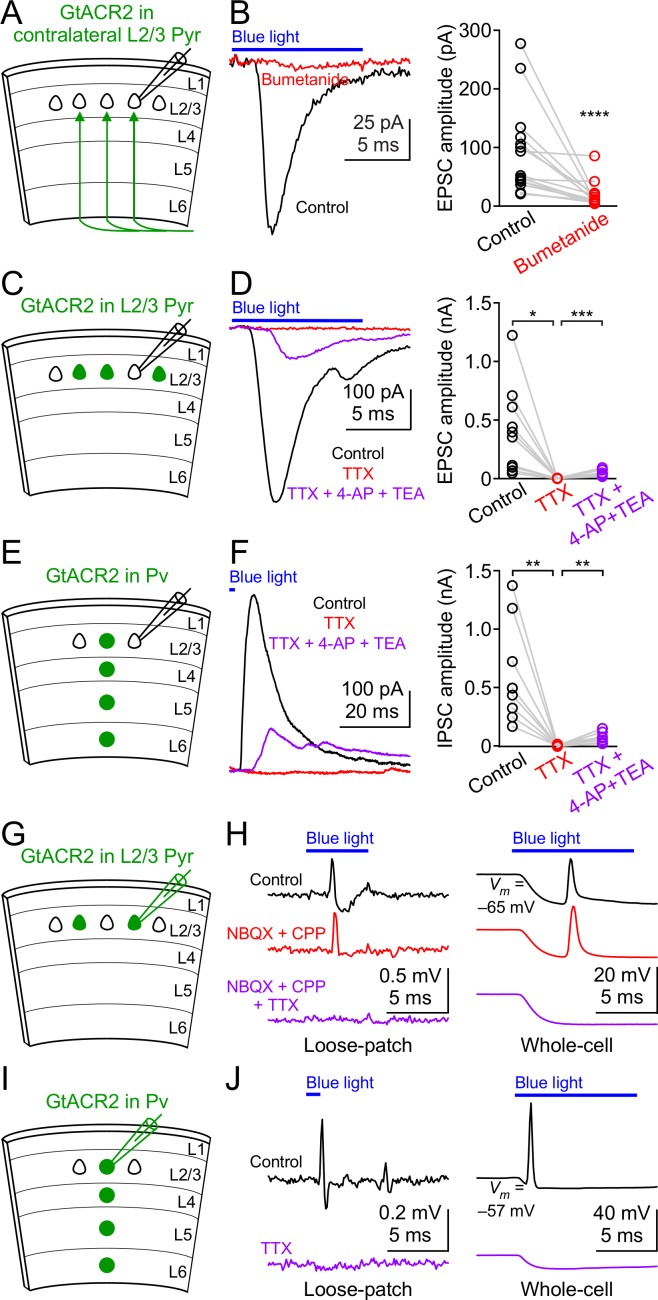
Figure 3. GtACR2 activation directly depolarizes the distal axon and presynaptic terminals and can result in antidromic spikes.
(A) Schematic of slice experiments in (B). GtACR2 in a subset of layer 2/3 pyramidal neurons in the contralateral hemisphere. (B) Left, photoactivation of GtACR2 in the callosal axons, severed from their somas, generated EPSCs in a GtACR2– neuron, which were diminished by bumetanide. Right, summary graph of similar experiments (n = 15, p<0.0001). (C) Schematic of slice experiments in (D). GtACR2 in a subset of layer 2/3 pyramidal neurons. (D) Left, photoactivation of GtACR2 generated EPSCs in a GtACR2– neuron, which were abolished by TTX, but partially recovered by the addition of voltage-gated potassium channel blockers, 4-AP (1.5 mM) and TEA (1.5 mM). Right, summary graph of similar experiments (n = 10; TTX vs. control, p=0.02, average EPSC amplitude in TTX was 2% of control; TTX + 4-AP + TEA vs. TTX, p=0.0004, average EPSC amplitude in TTX + 4-AP + TEA was 35% of control). (E,F) As in (C,D), but for Pv neurons. GtACR2 activation-induced IPSCs were abolished by TTX, but partially recovered by 4-AP and TEA (n = 9; TTX vs. control, p=0.006, average IPSC amplitude in TTX was 0.9% of control; TTX + 4-AP + TEA vs. TTX, p=0.008, average IPSC amplitude in TTX + 4-AP + TEA was 23% of control). (G) Schematic of slice experiments in (H). GtACR2 in a subset of layer 2/3 pyramidal neurons. (H) Photoactivation of GtACR2 generated antidromic spikes in GtACR2+ pyramidal neurons, which were not affected by NBQX and CPP, but were abolished by TTX in both loose-patch (left panel) and whole-cell (right panel) recordings. In the whole-cell recordings, the resting membrane potentials of those neurons that generated antidromic spikes were −68.1 ± 1.7 mV (mean ± s.e.m., n = 21). (I,J) As in (G,H), but for Pv neurons. The antidromic spikes in GtACR2+ Pv neurons were abolished by TTX. In the whole-cell recordings, the resting membrane potentials of those neurons that generated antidromic spikes were −60.0 ± 2.4 mV (mean ± s.e.m., n = 7).


