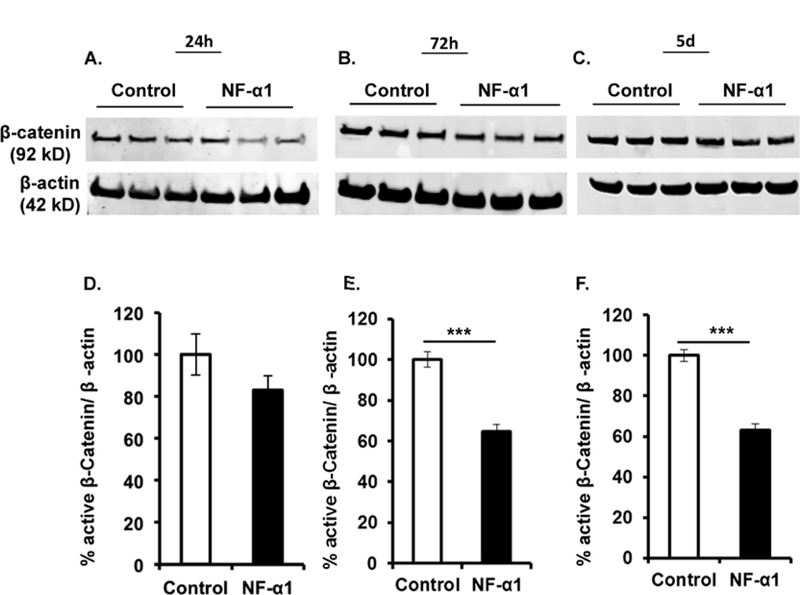
Figure 3. NF-α1 decreases the neurosphere proliferation through Wnt3a/β-catenin signaling.

Cell lysates were prepared, at different time points (24 h, 72 h and 5 day), from neurospheres grown in the presence of growth factors and treated with or without NF-α1 on day 0. Upper panels (A-C) represent Western blots of β-Catenin and β-actin at each time point. Quantification of the Western blots (D-F) shows a significant decrease in β-Catenin levels in NF-α1 treated cultures at 72 h & 5 d compared to untreated controls (E & F). N=3, ***p<0.0001, t test.
