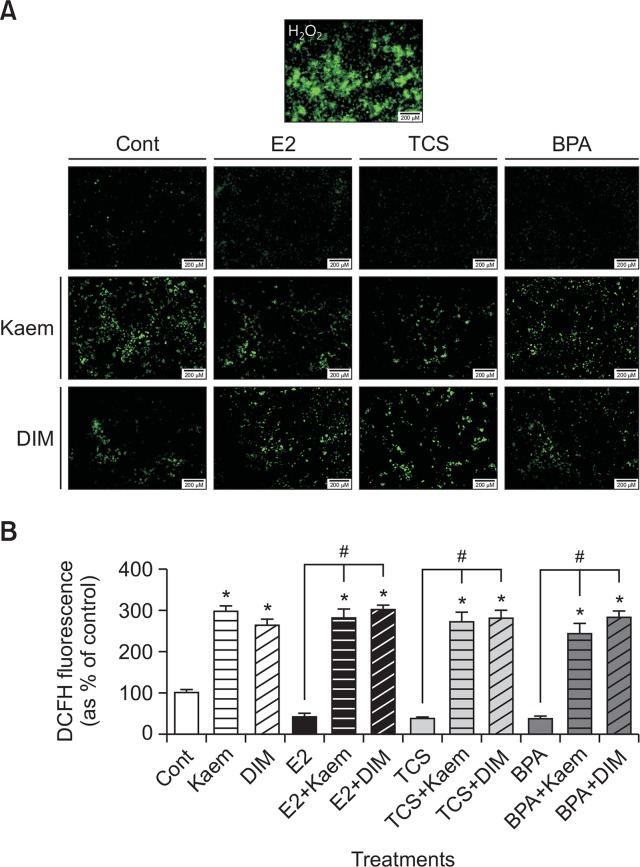
Fig. 3.
ROS formation in VM7Luc4E2 cells following treatment with E2, TCS, BPA, Kaem, and DIM. (A) VM7Luc4E2 cells were treated with 0.1% DMSO (a control), E2 (0.001 μM), TCS (1 μM), BPA (1 μM), Kaem (30 μM), DIM (15 μM), a mixture of E2 (0.001 μM), TCS (1 μM) or BPA (1 μM) and Kaem (30 μM), and a mixture of E2 (0.001 μM), TCS (1 μM) or BPA (1 μM) and DIM (15 μM), respectively, for 72 h. Cells were treated with H2O2 (a positive control for ROS production) for 30 min, after which H2DCF-DA was added to each well for 30 min, and the fluorescence intensity of DCF (an oxidized form of H2DCF) was measured and photographed using a fluorescence microscopy to detect ROS production. H2DCF-DA assay was replicated at least three times. (B) ROS production by each treatment was quantified using the Cell Sens Dimension software. *Mean values were significantly different from that of 0.1% DMSO (a control), p<0.05 (Dunnett’s multiple comparison test). #Mean values were significantly different from that of a single treatment of E2, TCS or BPA, p<0.05 (Student’s t-test). *Mean values were significantly different from that of 0.1% DMSO (control), p<0.05 (Dunnett’s multiple comparison test). #Mean values were significantly different from that of a single treatment of E2, TCS or BPA, respectively, p<0.05 (Student’s t-test).

