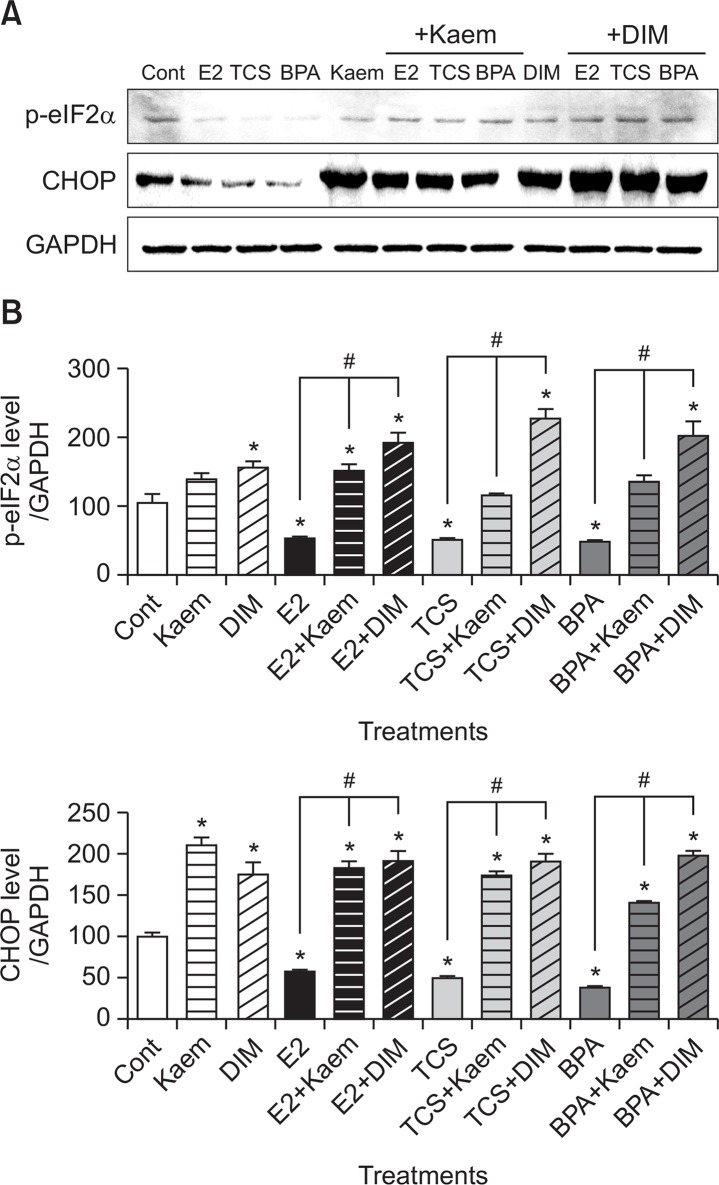
Fig. 4.
Protein expression of ER stress-related markers following treatment with E2, TCS, BPA, Kaem, and DIM. (A) VM7Luc4E2 cells were treated with 0.1% DMSO (a control), E2 (0.001 μM), TCS (1 μM), BPA (1 μM), Kaem (30 μM), DIM (15 μM), a mixture of E2 (0.001 μM), TCS (1 μM) or BPA (1 μM) and Kaem (30 μM), and a mixture of E2 (0.001 μM), TCS (1 μM) or BPA (1 μM) and DIM (15 μM) for 72 h. After protein extraction from the cells, the protein band corresponding to CHOP and p-eIF2α, respectively, was detected by Western blot assay. Western blot assay was replicated at least three times. (B) Quantification of the protein was accomplished by scanning the densities of bands on a transfer membrane using Lumino graph II. *Mean values were significantly different from that of 0.1% DMSO (a control), p<0.05 (Dunnett’s multiple comparison test). #Mean values were significantly different from that of a single treatment of E2, TCS or BPA, p<0.05 (Student’s t-test).

