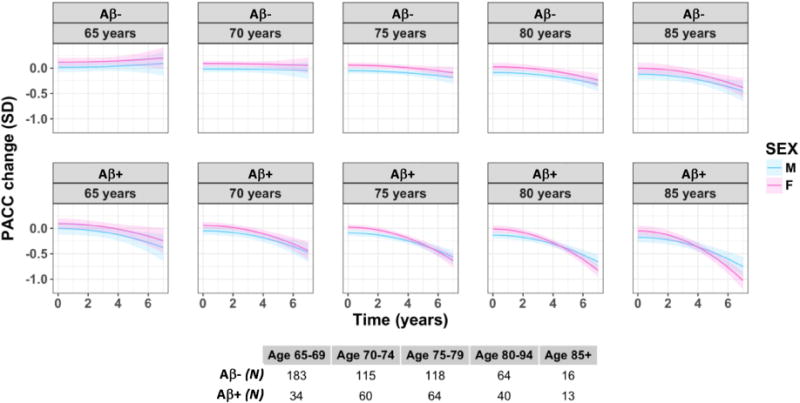
Figure 2.

Decline in global cognition (as measured by the PACC-5) by Aβ and sex across the age span (females = pink, males = blue). These are model estimates from a continuous model of Aβ; high and low Aβ is represented by the first quartile (on the top) and third quartiles (on the bottom) of Aβ along the continuous spectrum. Age is also treated continuously in the model, with this visualization showing model estimates at the following ages: 65, 70, 75, 80, 85 years. Each line extends to the longest follow-up period within that group.
