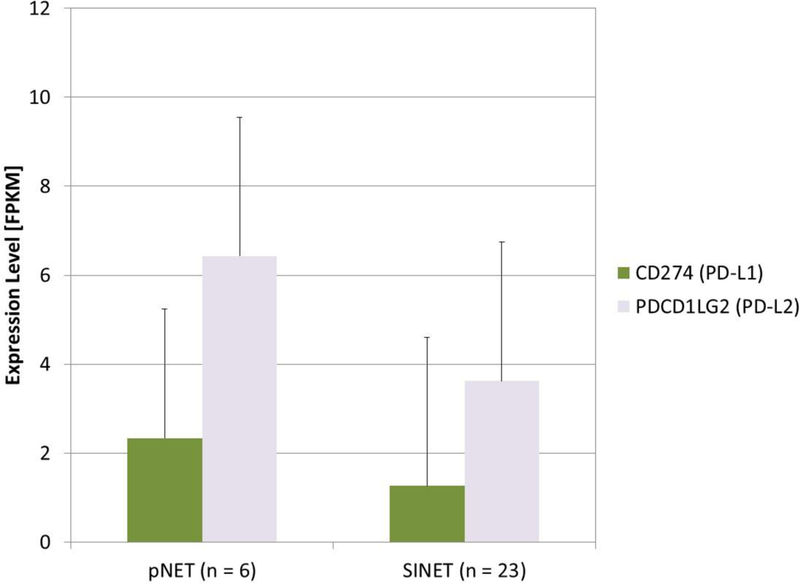
FIGURE 2. mRNA expression of PD-L1 and PD-L2 in pNET and SINET.

RNA-seq was performed in an independent cohort of 6 Pnet AND 23 SINET tissues, using fresh frozen tissue specimens. Mean expression levels of PD-L1 (CD274) and PD-L2 (PDCD1LG2) were extracted from transcriptome data as FKPM values. Data are presented as FPKM mean with standard deviation.
