Figure 2.
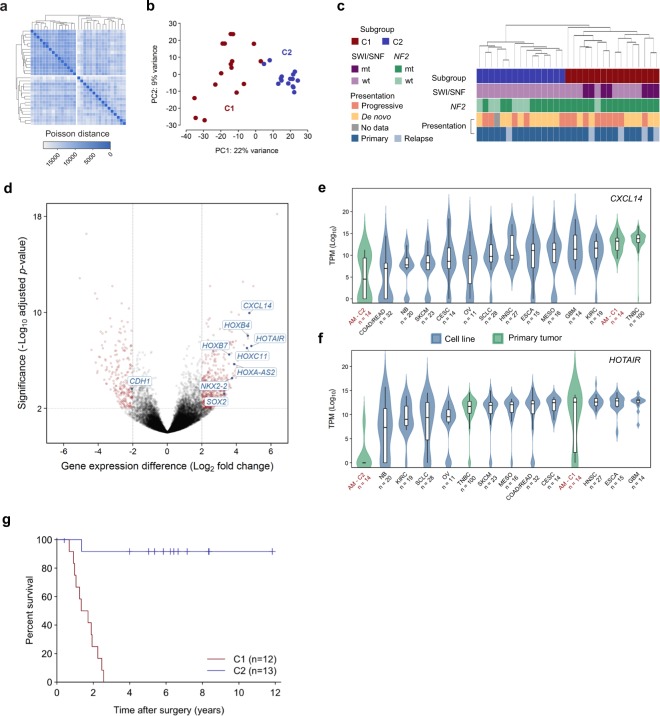
Transcriptomic classification of anaplastic meningioma. (a) Unsupervised hierarchical clustering and (b) principal component analysis of anaplastic meningioma gene expression revealed two subgroups (denoted C1 and C2). (c) Dendrogram obtained by unsupervised clustering annotated with clinical and genomic features. (d) Volcano plot depicting genes differentially expressed between C1 versus C2 anaplastic meningioma samples. X-axis, log2 fold change; y-axis, −log10 adjusted P-value. Genes with an adjusted P-value < 0.01 and absolute log2 fold change >2 are highlighted in red. (e,f) Box plots of (e) CXLC14 and (f) HOTAIR expression across 31 anaplastic meningomas classified into C1 and C2 subgroups, 100 primary breast tumors, and 219 cancer cell lines from 11 tumor types. Upper and lower box hinges correspond to first and third quartiles, horizontal line and whiskers indicate the median and 1.5-fold the interquartile range, respectively. Underlying violin plots show data distribution and are color-coded according to specimen source (blue, cell line; green, primary tumor). X-axis indicates tumor type and number of samples; y-axis shows log10 TPM values. (g) Kaplan-Meier curves showing overall survival for 25 anaplastic meningioma patients in C1 and C2 subgroups for whom follow-up data was available. Dashes indicate timepoints at which subjects were censored at time of last follow-up. TPM, transcripts per kilobase million; AM, anaplastic meningioma; TNBC, triple negative breast carcinoma; wt, wild-type; mt, mutated; PC, principal component.

