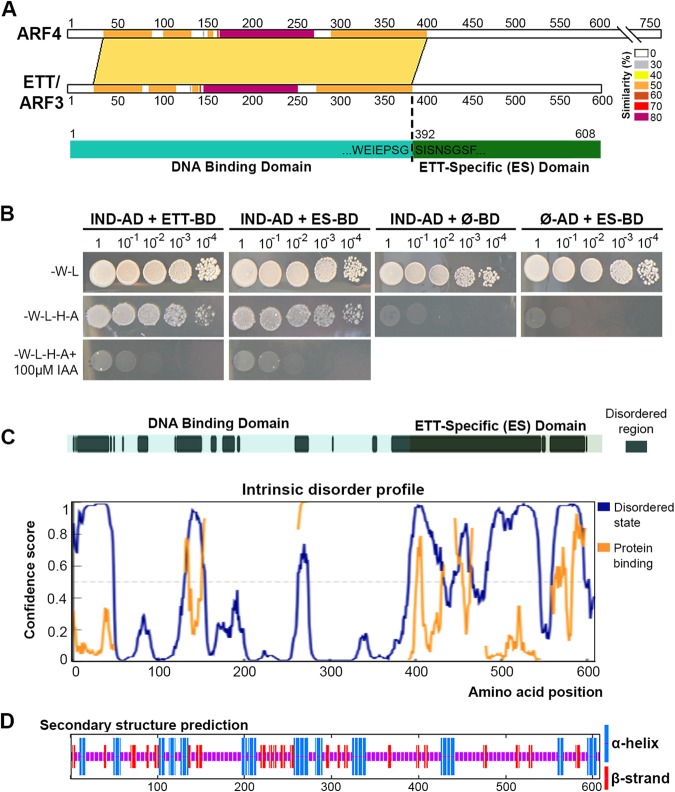
Figure 1.
Analyses of ETT domains, order-disorder prediction and secondary structure prediction. (A) Protein sequence alignment by SIM between ETT/ARF3 and its closest homologue ARF4. Different colours indicate percentage similarity. Below, schematic representation of the ETT showing limit of DNA binding domain (cyan) as determined by alignment with ARF4 and the following ETT-Specific (ES) domain (dark green). (B) Y2H assay between the ETT and IND, an A. thaliana transcription factor previously identified as ETT interactor8, and ETT-ES domain and IND. Interaction is observed on the selective plate -W-L-H-A. Yeast growth is inhibited by IAA in the media (lower panel). (C) A disorder prediction and putative protein binding regions for full-length ETT by PrDos and DISOPRED3 servers. (D) Secondary structure prediction by SOPMA.

