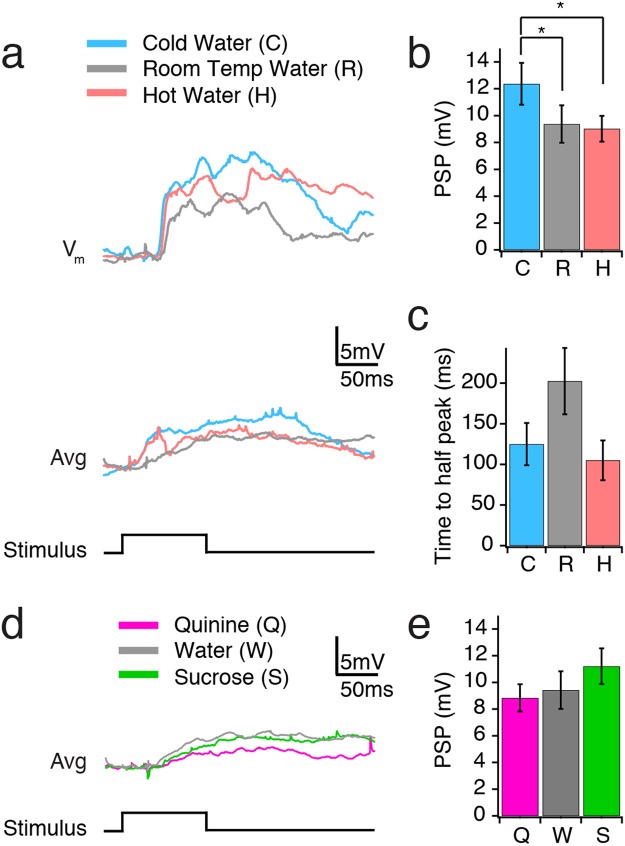
Figure 2.
Temperature- and taste-dependent responses of oral somatosensory cortex. (a) Average membrane potential responses to cold (C), room temperature (R) and hot (H) water of a single cell (averaged over multiple) (top) and all cells (averaged over multiple trials across all cells) (bottom; cold and room temperature: n = 20 cells; hot: n = 19 cells). Timing of water stimulus is indicated below. (b) Mean post-synaptic potential (PSP) amplitude for all cells in response to cold (C), room temperature (R) and hot (H) water. (c) Mean time to half peak in response to cold (C), room temperature (R) and hot (H) water. (d) Average membrane potential responses to quinine (Q), water (W) and sucrose (S) for all cells (n = 21 cells). Timing of liquid stimulus is indicated below. (e) Mean PSP amplitude for all cells in responses to quinine (Q), water (W), and sucrose (S). Bar graphs are mean ± SEM; *p < 0.05.

