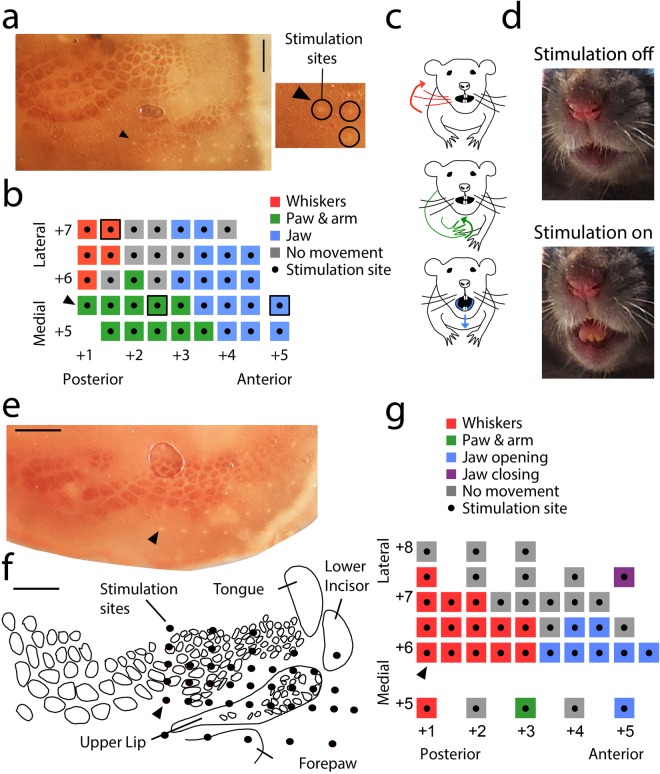
Figure 3.
Stimulation of oral somatosensory cortex elicits movements related to food consummatory behavior. (a) Photomicrograph of a tangential section of flattened somatosensory cortex stained for cytochrome-oxidase reactivity. Stimulation sites appear as small white dots in the tissue. The alignment between this photomicrograph and the map in b is indicated by a black arrowhead in each panel pointing to corresponding locations. Examples of visible stimulation tracks are magnified and circled. Scale bar: 1 mm. (b) Map of motor responses evoked by electrical stimulation of oral somatosensory cortex and surrounding regions. Numbers on the bottom and the left indicate the anterior/posterior and medial/lateral location of stimulation sites, respectively, in mm relative to bregma. The color surrounding each stimulation site indicates the associated motor response. (c) Schematic diagrams of motor responses displayed by the whiskers (top), paw and arm (middle), and lower jaw (bottom). The stimulation sites producing these responses are indicated by the black outlines in b. (d) Photographs of the animal’s mouth when stimulation is off (top) or on (bottom). The stimulation site producing this response is indicated by the black outline in b. Also, see Supplementary Video 1 for a representative orofacial movement pattern evoked by stimulation of somatosensory cortex. (e) Photomicrograph of a tangential section of flattened somatosensory cortex stained for cytochrome-oxidase activity from a second motor mapping experiment. Stimulation sites appear as small white dots in the tissue. The alignment between this photomicrograph and the map in f and g is indicated by a black arrowhead in each panel pointing to corresponding locations. Scale bar: 1 mm. (f) Reconstruction of the somatosensory map from a series of tangential sections. Stimulation sites are indicated as black dots. Scale bar: 1 mm. (g) Map of motor responses evoked by electrical stimulation of oral somatosensory cortex and surrounding regions. Numbers on the bottom and the left indicate the anterior/posterior and medial/lateral location of stimulation sites, respectively, in mm relative to bregma. The color surrounding each stimulation site indicates the associated motor response.

