Fig. 2.
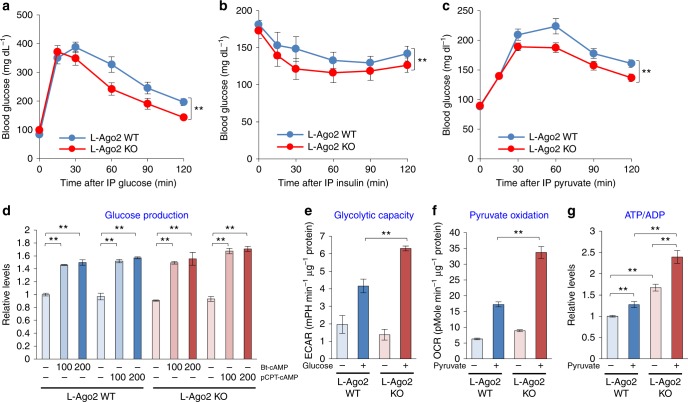
Hepatic Ago2-deficiency improves glucose metabolism. a Glucose tolerance test performed in L-Ago2 WT (n = 10) and KO (n = 8) mice fed NCD at 20 weeks of age. b Insulin tolerance test performed in L-Ago2 WT (n = 9) and KO (n = 6) mice fed NCD at 21 weeks of age. c Pyruvate tolerance test performed in L-Ago2 WT (n = 9) and KO (n = 10) mice fed NCD at 24 weeks of age. d Glucose production in primary hepatocytes isolated from L-Ago2 WT and L-Ago2 KO incubated in the absence (n = 4 for L-Ago2 WT and L-Ago2 KO, respectively) or presence of 100 or 200 μM Bt-cAMP or pCPT-cAMP (n = 2 for L-Ago2 WT and L-Ago2 KO, respectively). e Extracellular acidification (ECAR) in the absence or presence of 10 mM glucose in primary hepatocytes isolated from L-Ago2 WT (n = 3 for control, n = 6 for glucose) and L-Ago2 KO mice (n = 3 for control, n = 6 for glucose). f Mitochondrial oxygen consumption rate (OCR) in the absence or presence of 2 mM pyruvate in primary hepatocytes isolated from L-Ago2 WT (n = 3 for control and pyruvate, respectively) and L-Ago2 KO mice (n = 3 for control and pyruvate, respectively). g The ATP/ADP ratio in primary hepatocytes isolated from L-Ago2 WT and L-Ago2 KO mice in the absence (n = 6 for L-Ago2 WT and L-Ago2 KO, respectively) or presence of 5 mM pyruvate (n = 6 for L-Ago2 WT and L-Ago2 KO, respectively). Data are shown as the mean ± SEM. *p < 0.05, **p < 0.01

