Fig. 3.
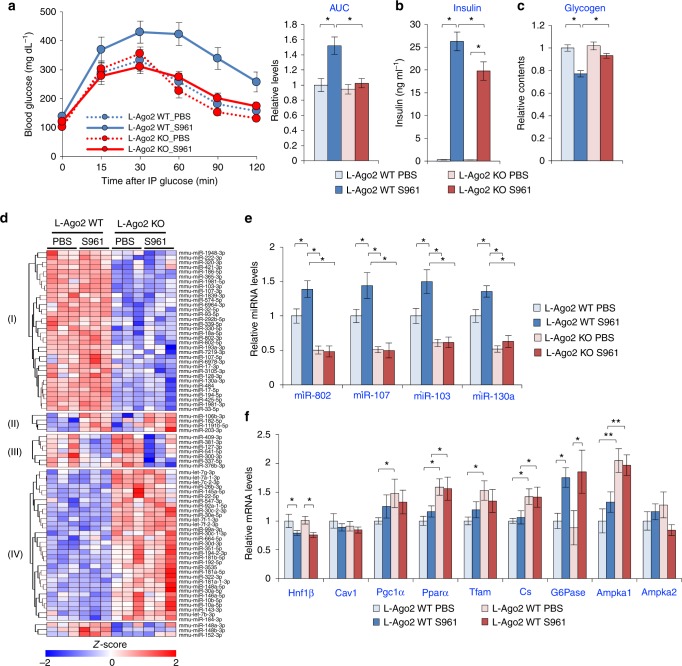
Hepatic Ago2-deficiency prevents S961-induced acute glucose intolerance. a Glucose tolerance tests at one-week post treatment of S961 or phosphate-buffered saline (PBS). L-Ago2 WT (n = 10 for PBS and n = 13 for S961) and KO (n = 11 for PBS and n = 14 for S961) mice fed NCD at 9 weeks of age were continuously treated with S961 (10 nM/week) via osmotic pumps. The graph on the right shows an integrated area under the glucose disposal curves (AUC) for each condition. b Serum insulin levels after daytime food withdrawal for 6 h in L-Ago2 WT and KO mice at 2 weeks post S961 (n = 7, each genotype) or PBS (n = 6, each genotype) treatment. c Hepatic glycogen contents in L-Ago2 WT and KO mice at 2 weeks post S961 (n = 7, each genotype) or PBS (n = 5, each genotype) treatment. d A heatmap diagram illustrating the differential expression of mature miRNAs in the liver of L-Ago2 WT and KO mice treated with PBS or S961 for 2 weeks. Significant miRNAs differentially expressed between genotypes were identified using DESeq2 (|fold change| > 1.25x and adjusted p < 0.0005). Clusters I and IV are miRNAs differentially expressed between L-Ago2 WT (n = 6) and L-Ago2 KO (n = 6) groups. Clusters II and III are miRNAs differentially expressed by S961 treatment in WT and KO groups, respectively. The log2 expression values were scaled by z-score. e, f Effect of S961-treatment on expression of MD-miRNAs (e) and genes regulating energy metabolism (f) in the liver of L-Ago2 WT and KO mice treated with PBS or S961 (n = 6, each group) for 2 weeks. Data are shown as the mean ± SEM. *p < 0.05, **p < 0.01

