Figure 1.
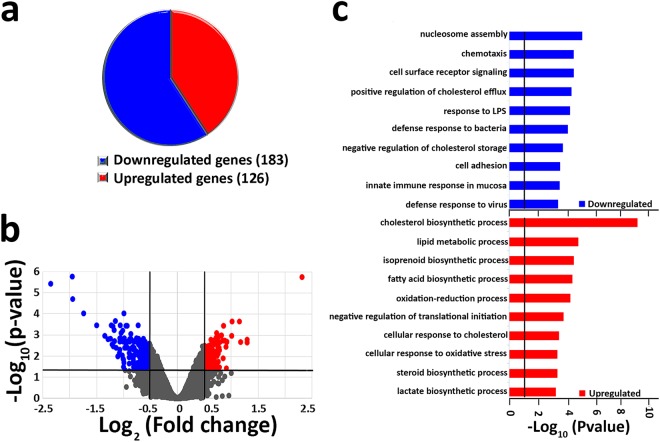
Hypercapnia induces transcriptional changes in NHBE cells. Global gene expression was assessed in ALI-differentiated NHBE cells after exposure to 5% CO2 (normocapnia) or 20% CO2 (hypercapnia) for 24 h. (a) Pie chart indicating proportion of genes downregulated or upregulated by hypercapnia. (b) Volcano plot showing statistical significance (−log10 [P value]) plotted against log2 fold change for hypercapnia vs normocapnia. Plot indicates significantly upregulated genes (log2 [fold change]≥+0.5, adjusted P value ≤ 0.05) in red and downregulated genes (log2 [fold change]≤−0.5, adjusted P value ≤ 0.05) in blue. (c) Bars represent the top 10 GO biological processes downregulated (blue) and upregulated (red) by high CO2.

