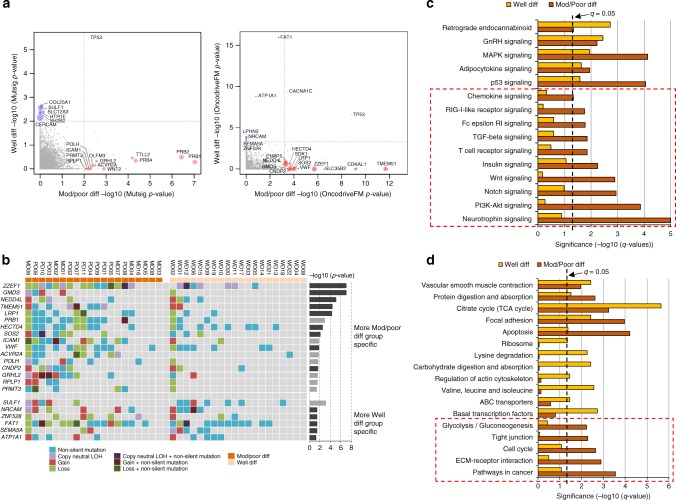
Fig. 7.
Comparison of significantly mutated genes and pathways between moderate/poor and well-differentiated groups. a Group-specific SMGs from the randomisation test based on MutSigCV and OncodriveFM p-values, respectively. Moderate/poor group-specific genes were marked with red circles, while well-differentiated group-specific genes were marked with blue circles. The size of the circle corresponds to its significance compared to that expected by chance. b Mutation OncoPrint of group-specific genes that were expressed across 40 cSCC samples in moderate/poor and well-differentiated groups. Significance level (-log10(p-value)) from the randomisation test was also shown for each gene as bar charts. Genes derived from the OncodriveFM statistics were shown in dark grey, while genes derived from MutSigCV statistics were in light grey. Genes at the top panel appeared to be more moderate/poor group specific, while genes at the bottom panel were more well-differentiated group specific. c Significantly mutated KEGG signalling pathways and d biological processes between moderate/poor and well-differentiated groups. Significant pathways and processes in moderate/poor group only were marked with a dotted square. Pathways and biological processes in the bar charts were sorted with terms significant in both groups at the top, and terms significant in moderate/poor group only at the bottom (indicated with red dashed boxes)

