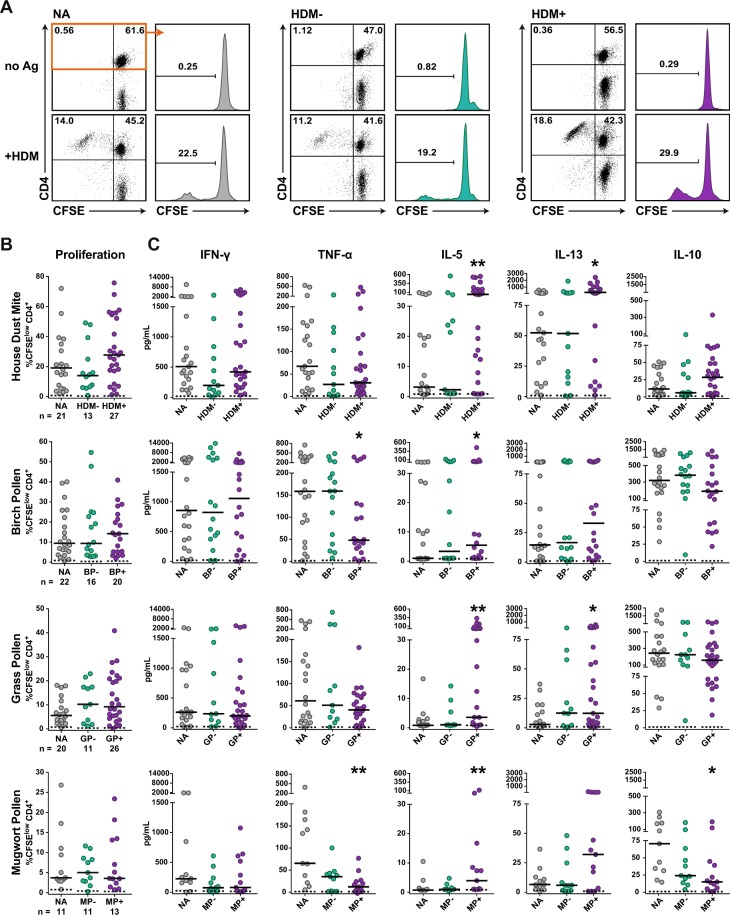
Figure 2.
CD4+ T cell responses of allergic and non-allergic donors to common allergen sources. CFSE-labeled PBMCs of allergic and non-allergic individuals were stimulated with allergenic extract of house dust mites (HDM), birch pollen (BP), grass pollen (GP) or mugwort pollen (MP) for 6-7 days. Cells were harvested, stained for CD4 and analyzed by flow cytometry. (A) T cell proliferation of a representative non-allergic individual (NA), an allergic patient not sensitized to house dust mite (HDM−) and a house dust mite allergic patient (HDM+) in response to house dust mite extract is shown. Dot plots depict CFSE versus CD4 in live cells and histograms show percentage of CFSElow cells gated on live CD4+ T cells. (B) Percentage of CFSElow CD4+ T cells are shown for the indicated number of donors and median percentage of CFSElow CD4+ T cells for each group is indicated as line. (C) Culture supernatants were collected, pooled from triplicates and analyzed by multiplex flow cytometry. Median concentration is indicated as line. (B,C) Dashed lines indicate data for unstimulated conditions. Statistical significances of differences in the responses to allergen stimulation between PBMCs derived from NA and allergic patients were calculated using the Mann-Whitney test (*P ≤ 0.05 and **P ≤ 0.01).

