Figure 3.
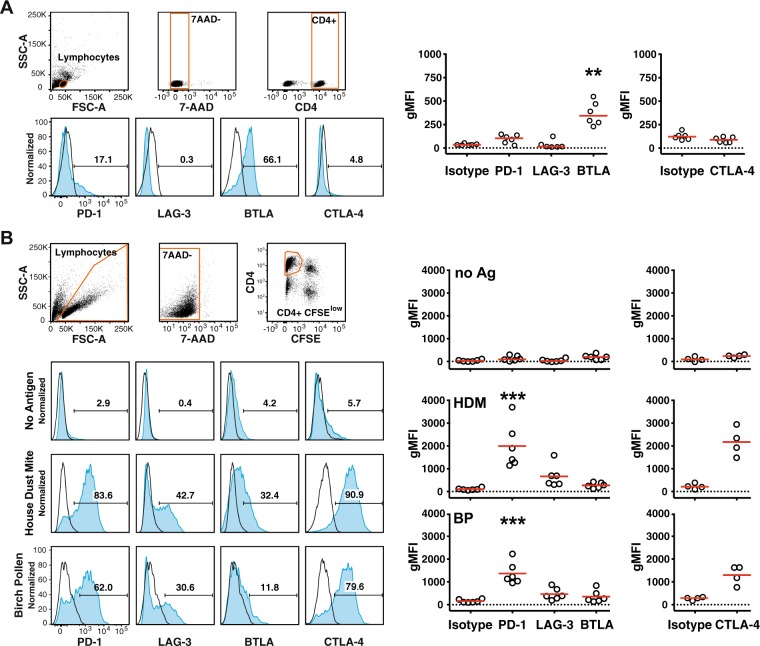
Expression of the immune checkpoints PD-1, LAG-3, BTLA and CTLA-4 by CD4+ T cells responding to common allergen sources. (A) Unstimulated PBMCs of study donors were analyzed for expression of indicated immune checkpoints using the gating strategy depicted in the upper panels. Blue histograms show the expression of indicated immune checkpoints of a representative allergic donor and numbers indicate percent receptor positive cells. Scatter plots on the right side show reactivity of antibodies to PD-1, LAG-3, BTLA and CTLA-4 and isotype control of 6 donors (3 NA, 3A). (B) CFSE-labeled PBMCs of four to six donors (2 NA, 4A) were left unstimulated or stimulated with allergenic extracts for 7 days. 7-AAD negative CFSElow CD4+ T lymphocytes were analyzed for the expression of the indicated immune checkpoints as shown in the blue histograms for one representative donor (left) and summarized in cumulative scatter plots (right). For expression analysis in unstimulated CD4+ T cells the gate was set to CFSEhigh cells. Open histograms represent isotype control stainings. gMFI; geometric mean fluorescence intensity. Statistical analysis was performed using the Friedman test (**P ≤ 0.01 and ***P ≤ 0.001).

