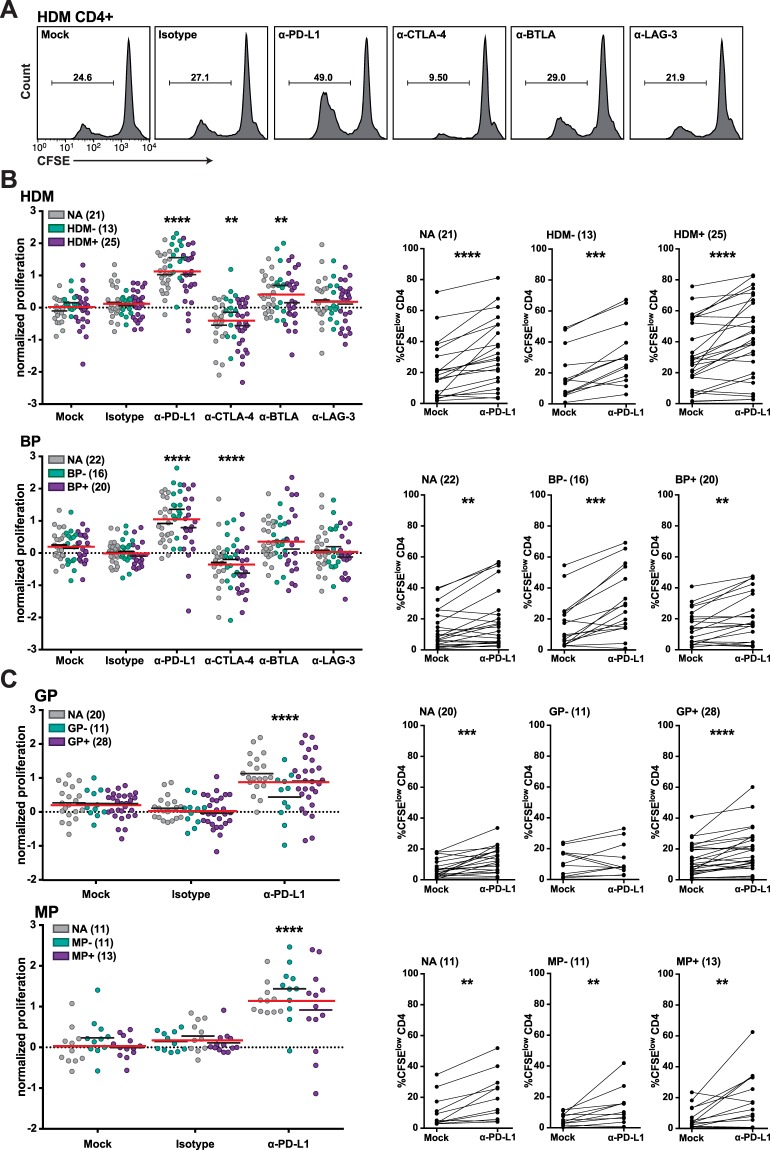
Figure 4.
Influence of immune checkpoint inhibitors on CD4+ T cell proliferation in response to allergenic extracts. CFSE-labeled PBMCs of allergic and non-allergic individuals were stimulated with allergenic extracts in presence of blocking antibodies to the indicated molecules. After 6–7 days, cells were harvested, stained for CD4 and analyzed by flow cytometry. (A) Histograms show the effect of checkpoint inhibitors on CD4+ T cell proliferation of a representative HDM+ allergic patient in response to HDM extract. Numbers indicate percentage of CFSElow cells gated on live CD4+ T cells. (B,C) Normalized proliferation scores and percentages of CFSElow CD4+ T cells upon stimulation with HDM and BP extract (B) as well as GP and MP extract (C) in absence and presence of checkpoint inhibitors (left panels). Each data point represents the mean of triplicates of one donor. Values in brackets indicate numbers of donors. Median normalized proliferation for each group or the whole cohort is indicated as black and red line, respectively. Comparison of percentages of CFSElow CD4+ T cells without and with PD-L1 blockade is depicted in the right panels. Stars indicate significant differences compared to mock control calculated with Friedman test and Dunn’s multiple comparison post hoc test (**P ≤ 0.01, ***P ≤ 0.001 and ****P ≤ 0.0001).

