
Fig. 1. The unadjusted standardized PRS derived from PGC-SZ are plotted for controls and cases (from left to right) with no history of psychosis, psychosis during only depression, and psychosis during mania.
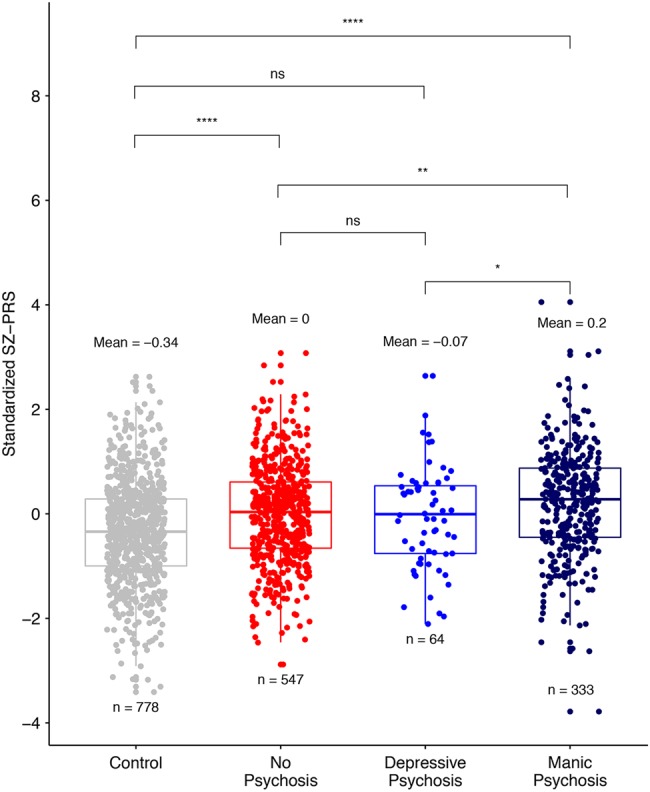
The y-axis shows the standardized SZ-PRS score. The mean PRS and subgroup sample size are printed above and below each boxplot, respectively. Significance of comparisons between groups after adjustment for principal components are shown above (ns = not significant, *<0.05, **<0.01, ***<0.001, ****<0.0001)