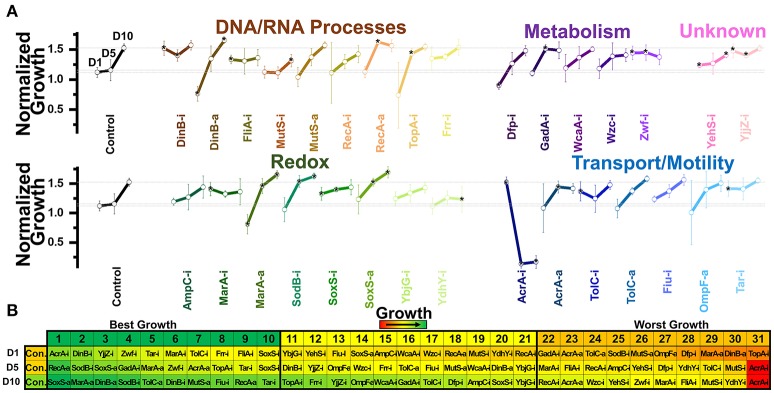
Figure 5.
Normalized growth (maximum OD/starting OD) of E. coli harboring CRISPR gene perturbations during 10.0% vol/vol n-hexane exposure. (A) Change in the growth of each strain over 10 days of exposure, with quantification on days one (D1), five (D5), and ten (D10). Strains are organized based on pathways affected by perturbation. Dashed lines extend from the control for each experimental day. A two-tailed type II t-test was used to calculate significance (as indicated by *P < 0.05) relative to the control on the same experimental day. Error bars represent the standard deviation of four biological replicates. (B) Organized rankings of strains with highest growth reached on each day, with the color scale to indicate relative growth. The top 10 and bottom 10 are indicated as “best growth” and “worst growth,” respectively.

