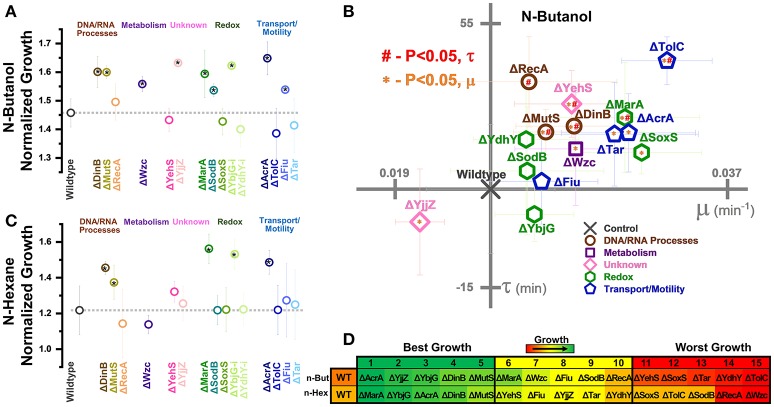
Figure 6.
Growth of gene knockouts in relation to wildtype E. coli BW25113. Normalized growth (maximum OD/starting OD) of knockouts in (A) 0.5% vol/vol n-butanol or (C) n-hexane. Strains are organized based on pathways affected by perturbation. Dashed lines extend from the control (A) two-tailed type II t-test was used to calculate significance (P < 0.05) relative to the control. (B) Growth rates (μ) and lag times (τ) of knockouts during 0.5% vol/vol n-butanol exposure. Axes are set to intersect the control in each graph. A two-tailed type II t-test was used to calculate significance (P < 0.05) relative to the control in growth rates (orange *) and lag times (red #). (D) Organized rankings of strains with highest growth reached on each day, with the color scale to indicate relative growth. The top five and bottom five are indicated as “best growth” and “worst growth,” respectively. All error bars represent the standard deviation of four biological replicates.

