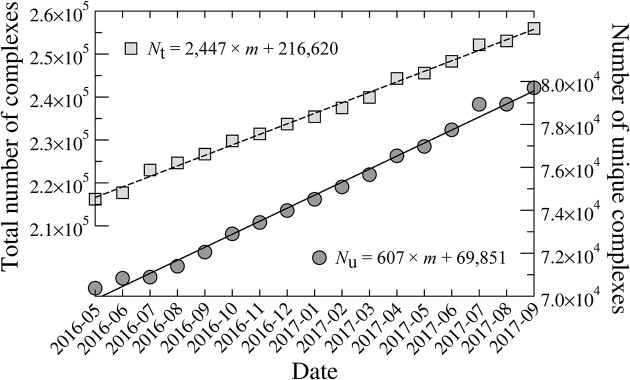
Figure 1:
Deposition rate of ligand-bound structures to the Protein Data Bank. The total number of protein chains binding small molecules (light gray squares and a dashed line) is counted at any point in time. The number of unique complex structures is obtained by clustering individual chains at 80% sequence identity (dark gray circles and a solid line). Nt and Nu in the linear regression equations are the total and unique number of ligand-protein complexes, respectively, and m stands for month.

