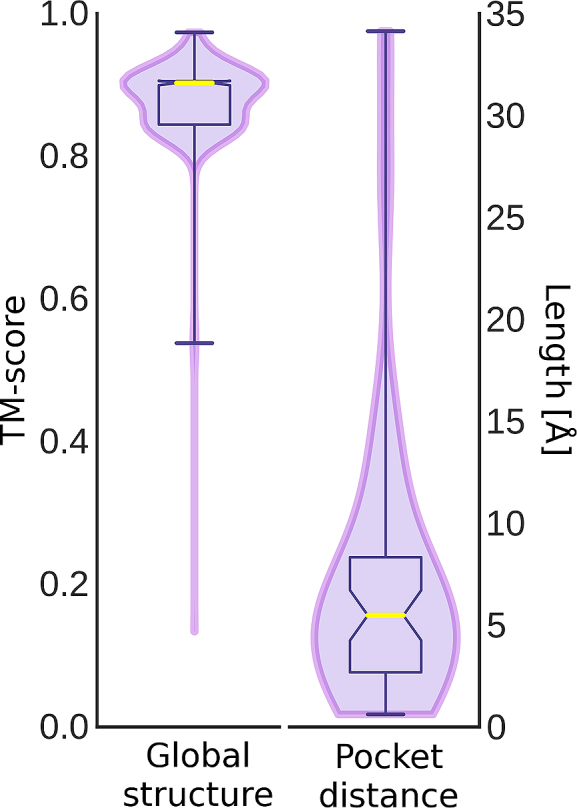
Figure 4:

Violin and box plots for the distribution of validation scores. The accuracy is assessed for remote homology complex models in the validation set. The global structure similarity is measured with the TM-score. The pocket distance is measured between the predicted pocket center and the geometric center of the ligand in the experimental structure superposed onto the eThread model. Horizontal yellow lines represent median values.
