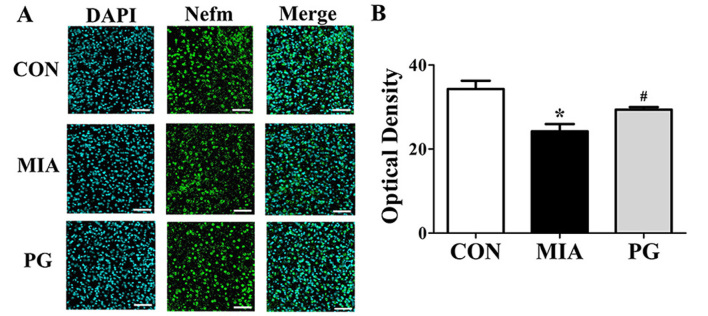
Figure 3.
Immunohistochemical analysis of Nefm expression in the medial prefrontal cortex of MIA-induced mice. (A) Confocal microscopy of Nefm immunofluorescent staining (secondary anti-mouse, green; Alexa Fluor 488); nuclei were stained with DAPI (blue). Treatment with PG inhibited this decrease. (B) Quantitative analysis of Nefm expression revealed a significant decrease of Nefm expression in the MIA group compared with CON. Scale bar, 50 µm. Data are presented as the mean ± standard error of the mean; *P<0.05 vs. CON; #P<0.05 vs. MIA. CON, control group; MIA, maternal induced activation group; Nefm, neurofilament M; PG, Panax ginseng-treated MIA group.

