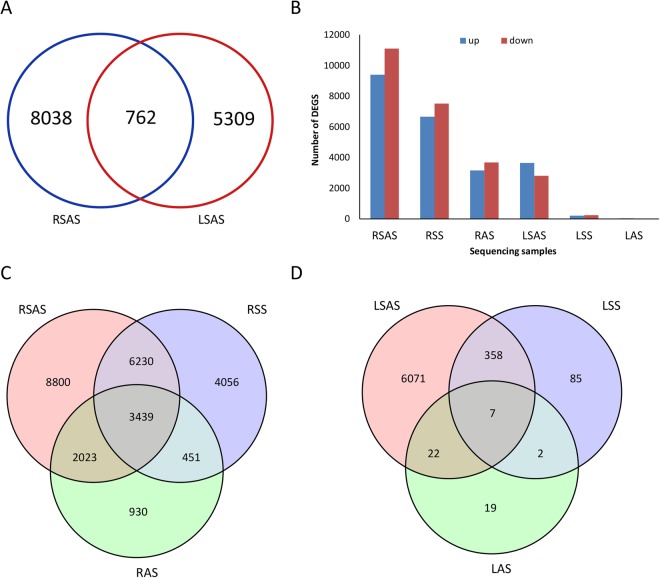
Figure 3.
Analysis of differentially expressed genes. RSS: Root, 100 mM NaCl; RAS: Root, 0.125 mM NaOH; RSAS: Root, 50 mM Na2CO3. LSS: Leaf, 100 mM NaCl; LAS: Leaf, 0.125 mM NaOH; LSAS:Leaf, 50 mM Na2CO3. (A) Specific DEGs in roots and leaves under SAS. (B) Number of up-regulated and down-regulated DEGs of each sample. (C) Number of DEGs in roots under different stress treatments. (D) Number of DEGs in leaves under different stress treatments.

