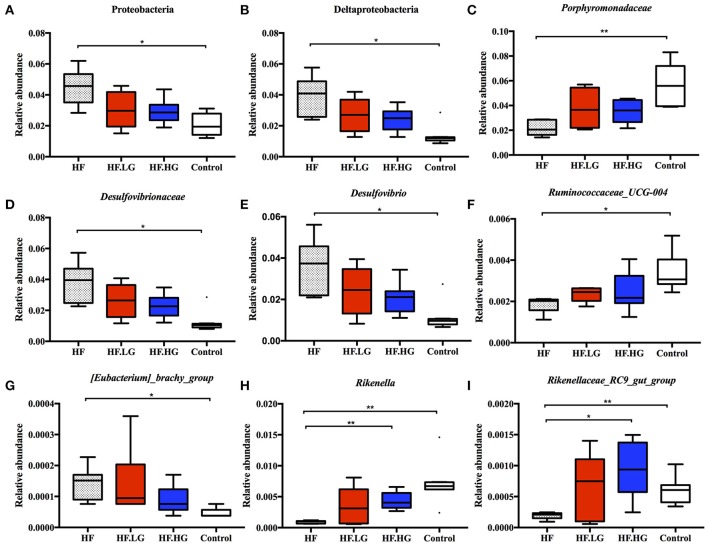
Figure 6.
Relative abundance of bacterial taxa at different taxonomic levels in each group. (n = 6–8/group). (A) Proteobacteria; (B) Deltaproteobacteria; (C) Porphyromonadaceae; (D) Desulfovibrionaceae; (E) Desulfovibrio; (F) Ruminococcaceae_UCG-004; (G) [Eubacterium]_brachy_group; (H) Rikenella; and (I) Rikenellaceae_RC9_gut_group. HF, high-fat diet without genistein; HF. LG, high-fat diet with low-dose genistein; HF. HG, high-fat diet with high-dose genistein; Control, normal control diet. Data was analyzed by MetaStat. Mean values were significantly different between other group and the HF group: *q < 0.05, **q < 0.01.

