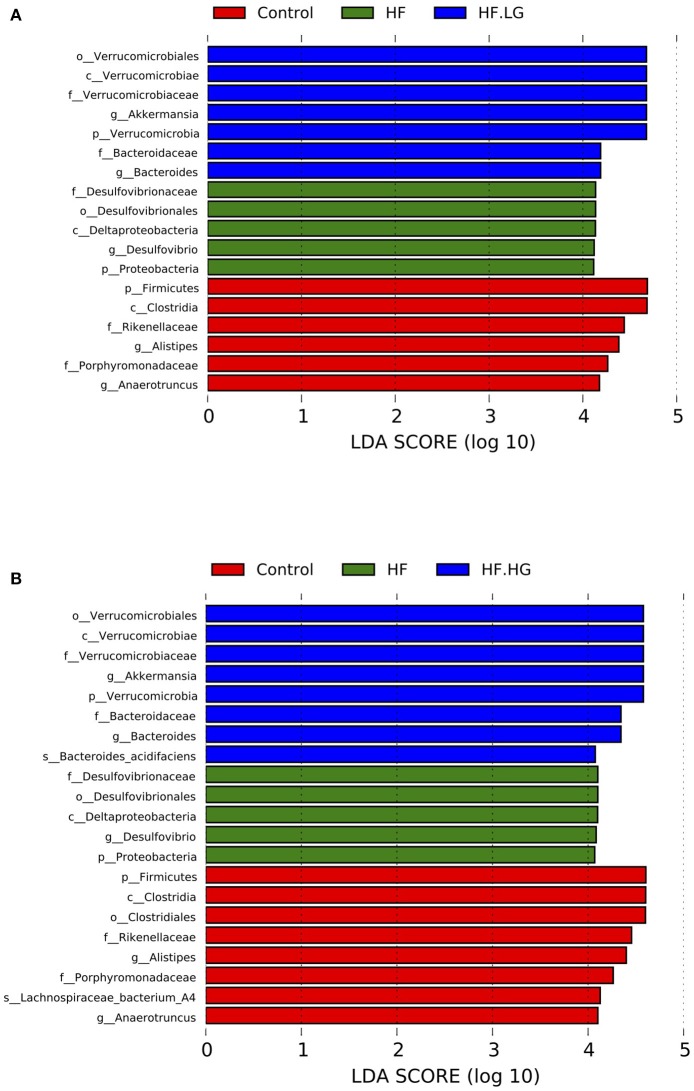
Figure 7.
The LEfSe analysis of the different gut microbiota from the phylum level down to the species level (n = 6–8/group). (A) Differently enriched bacteria among the HF-HF.LG-Control group; and (B) Differently enriched bacteria among the HF-HF.HG-Control group. HF, high-fat diet without genistein; HF. LG, high-fat diet with low-dose genistein; HF. HG, high-fat diet with high-dose genistein; Control, normal control diet.

