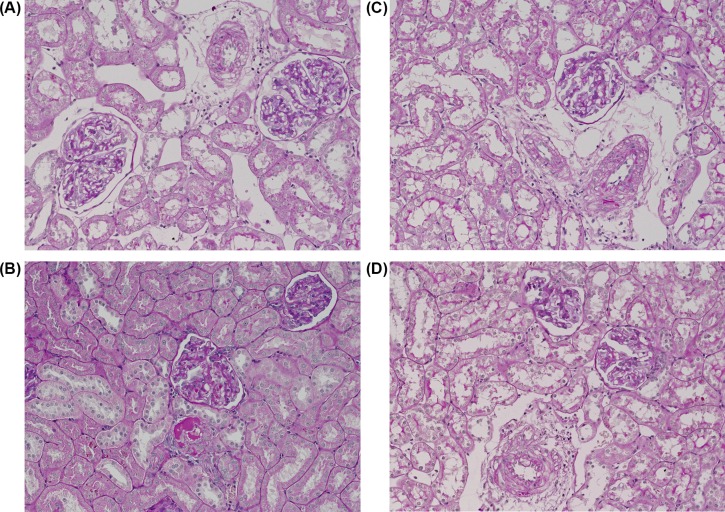
Figure 3. Representative histological images used for calculation of the glomerulosclerosis index.
(A) Untreated non-induced Cyp1a1-Ren-2 transgenic rats – normal renal cortex, (B) untreated I3C-induced Cyp1a1-Ren-2 transgenic rats – interlobular artery with fibrinoid necrosis, glomerulus (in the center) with insudation, (C) I3C-induced Cyp1a1-Ren-2 transgenic rats treated with 20-HETE antagonist – interlobular artery with segmental fibrinoid necrosis, (D) I3C-induced Cyp1a1-Ren-2 transgenic rats treated with AT1 receptor antagonist – interlobular artery with small segmental fibrinoid necrosis. Dashed lines encircle the large vessels. Magnification 200×. Periodic acid–Schiff staining.

