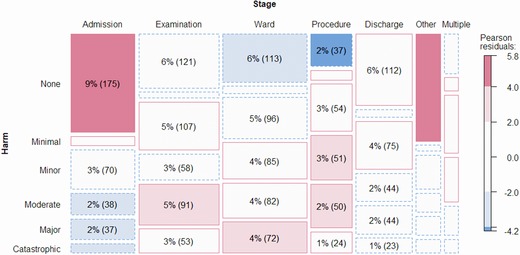
Figure 2.

Association Between Harm and Stages of Carea
aThe area of tiles is proportional to the number of problems within the cross categorization. Tile text reports the number of problems as a percent of all problems. Text did not fit in some small tiles. Tile border indicates more (solid) and fewer (dotted) observations than expected. Tile shading indicates chi‐square test residuals less than 2 (white, approximating p > .05), between 2 and 4 (light shading, approximating p < .05), and greater than 4 (dark shading, approximating p < .0001). [Color figure can be viewed at http://wileyonlinelibrary.com]
