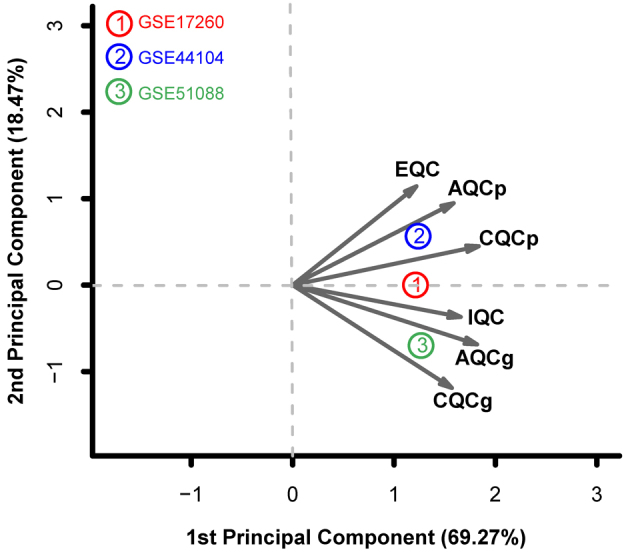
Figure 1.

Principal component analysis of the GSE17260, GSE44104 and GSE51088 datasets. X-axis represents the first principal component and the Y-axis represents the second principal component. IQC, internal quality control; EQC, external quality control; AQCg, accuracy quality control of genes; AQCp, accuracy quality control of pathways; CQCg, consistency quality control of genes; CQCp, consistency quality control of pathways.
