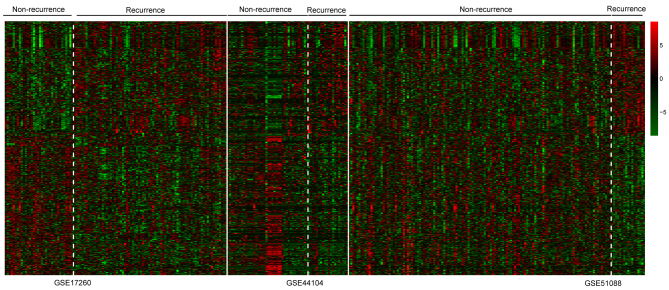
Figure 2.
Hierarchical clustering heatmap of samples from patients with OC in GSE17260, GSE44104 and GSE51088 datasets using the expression levels of 639 differentially expressed genes. Red panels represent high expression; green panels represent low expression. Bars represent samples from patients with non-recurrent and recurrent OC in each dataset. OC, ovarian cancer.

